Figure 6.
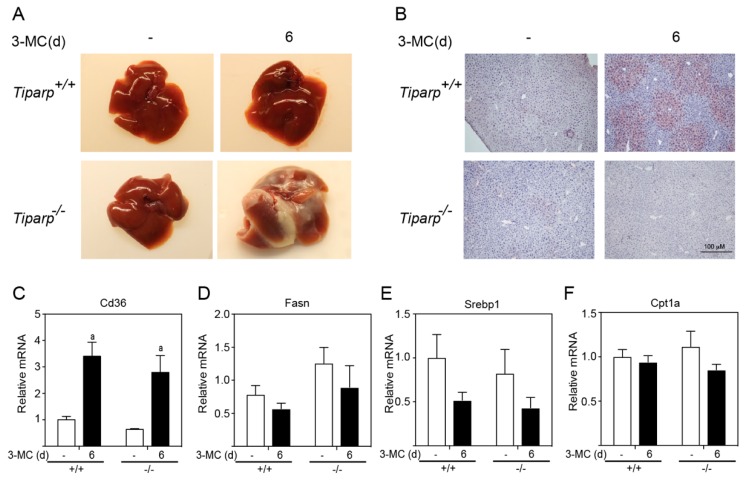
3MC induces hepatosteatosis in WT but not in Tiparp−/− mice. (A) Gross liver images from corn oil- and 3MC-treated WT and Tiparp−/− mice at day 6. (B) Oil Red O staining was conducted to visualize neutral fats. Gene expression levels of Cd36, (C), Fasn (D), Srebp1 (E), and Cpt1a (F). Data represent the mean ± SEM of inflammatory genes; n = 3. a p < 0.05 two-way ANOVA comparison between genotype-matched corn oil- and 3MC-treated mice followed by a Tukey’s post hoc test for multiple comparisons.

