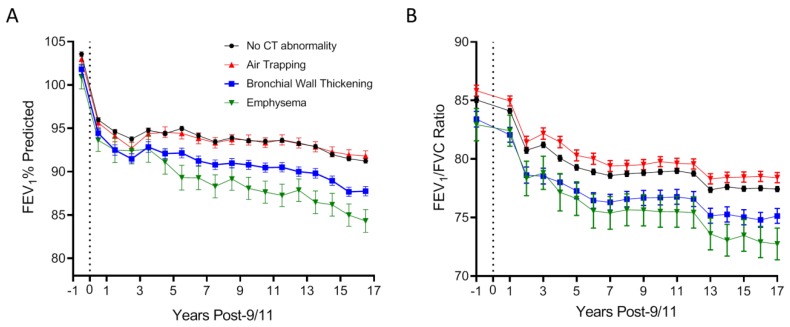
Figure 4.
Longitudinal lung function according to CT abnormality. (A) shows mean FEV1 % predicted (± SEM) in each year between 11/9/2000 and 10/9/2018 in the no chest CT diagnosis (black circles), isolated air trapping (blue triangles), isolated bronchial wall thickening (brown squares), and isolated emphysema (red inverted triangle) groups. (B) shows mean (± SEM) FEV1/FVC ratio in each year in the aforementioned groups, adjusted for age, race and height. Number of subjects in each nonoverlapping group is shown. The vertical line at 0 represents 11/9/2001.

