Table 2.
Indirect evidence for safety of IUD among women at increased risk of STIs
| Author, year, location, funding source | Study design, follow-up duration | Population, intervention | Comparison groups | Outcome | Results | Strengths | Weaknesses | Grade |
|---|---|---|---|---|---|---|---|---|
| Grentzer, 2015 [16] United States The Susan Thompson Buffett Foundation; NICHD award K23HD070979; Washington University Institute of Clinical and Translational Science grants, National Center for Advancing Translational Sciences grant |
Secondary data analysis from prospective cohort (CHOICE project [27]) |
N =5087 women aged 14–45 years with Cu- (n =1057) and LNG-IUD (n =4035) placement and NAAT for gonorrhea and chlamydia 140/5087 (2.8%) + chlamydia 16/5087 (0.3%) + gonorrhea | Algorithm: 1: age 2: age, 1 + sex partners 3: age, 1 + sex partners, condom use or STI history |
For each algorithm compared with NAAT results: Sensitivity Specificity PPV NPV NLR |
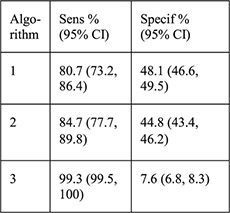 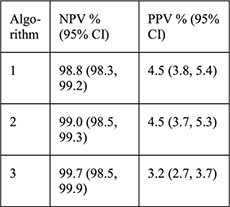 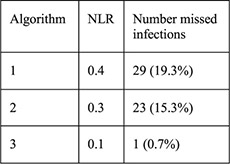 PID rates not reported for this sample, for CHOICE IUD users self-report rate was 0.46% at 6 months [28] |
Large sample size all undergoing STI screening by algorithms and NAAT Screening tests described with credible reference Treatment provided if testing+ Models based on 2010 CDC STD treatment guidelines [23] for STI screening except for survival sex Risk factors assessed by interview not records |
Groups with testing + and − differed at baseline by multiple potential confounders Results not separated by IUD type (LNG vs. Cu) Did not examine PID rates for women with screening + vs. − Unclear generalizability for large study within small geographic area NAAT has high false-positive rate in low-prevalence areas, so misclassification possible among low-risk groups |
II-2 (diagnostic accuracy study), fair |
| Papic, 2015 [22] United States R01PG000859 from Department of Health and Human Services, Office of Population Affairs |
Secondary data analysis from prospective cohort [29] 3 months |
Women aged 15–45 years seeking pregnancy testing or EC who elected same-day Cu- or LNG-IUD placement or no IUD (n=1060), all underwent STI | For those with survey data: 1. Same-day IUD placement (n=28) 2. Delayed IUD placement (n=17) 3. No IUD placement (n=227) |
PID rate within 3 months by self-report, chart review or diagnostic code STI treatment | Among survey data group: No difference in PID rates by self-report between 3 groups (4.6%, 11.8%, 4.9%, p = .54 for 1 vs. 2, p=1.00 for 1 vs. 3) No difference in being treated for an STI within 3 months (14.3%, 5.9%, 17.0%; p=.64 for 1 vs. 2, p= 1.00 for 1 vs. 3) |
3 groups from survey data sample similar at baseline, potential confounders assessed at baseline Authors assessed women with survey data and women | Small proportion of total sample with demographic baseline data, small samples of women having IUDs placed Excluded women with signs of cervicitis from same-day placement only; potentially |
II-2, poor |
| screening with 3-month follow-up survey data (n=272, with chart review for n=51) or chart review by EMR for 3 months (n=947) 0.8% chlamydia prevalence |
For EMR data: 1. Same-day IUD placement (n =31) 2. Delayed IUD placement (n =40) 3. Used hormonal contraceptives within 3 months (n=312) 4. Used no prescription contraception within 3 months (n=564) |
Among EMR group: No difference in PID rates (95% CI) between 4 groups: 1. 6.5% (0.8–21) 2. 5.0% (0.6–16.9) 3. 1.9% (0.7–4.1) 4. 0.9% (0.3–2.1) |
without, and assessed women with EMR data available and women without for total sample n=1060 and reported no differences by limited demographic information available Treatment provided iftesting+ | included in other groups PID by self-report or EMR and when cross-referenced did not always match PID diagnosis criteria not defined Did not report STI screening results at baseline by group or treatment details Did not assess outcomes by potential confounders High LTFU of surveys |
||||
| Murphy, 2012 [17] United States NICHD award R21HD063028 |
Secondary data analysis from prospective cohort and pilot study of Cu-IUD vs. LNG for EC [30,31] |
Women aged 18–30 years seeking EC who chose Cu-IUD and had same-day STI screening with adequate results (n = 197) 8/197 (4.1%) + chlamydia 0/197 (0%) + gonorrhea |
1: History of STI 2: Aged < 25y 3: 2 + partners 4: Aged <25 years and history of STI 5: Aged <25 years and 2 + partners 6: History of STI and 2 + partners 7: Aged <25 years and history of STI and 2 + partners | For each screening type compared with laboratory testing: Sensitivity Specificity PPV NPV PLR NLR |
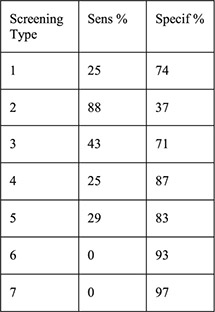 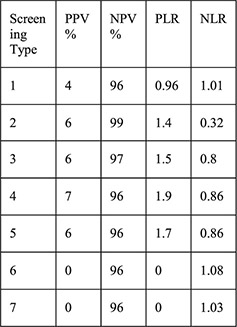 No cases of upper genital tract infection |
Entire sample had STI screening by algorithms and laboratory STI screening for gonorrhea and chlamydia Screening tests by algorithms described with credible reference Treatment provided if testing+ Risk factors assessed by interview not records |
Small sample, 2 sites with only 8 cases testing+ Women at high risk of PID were excluded from prospective cohort Unclear generalizability for small geographic area with low prevalence of cervical infections Screening test type not reported |
I I - 2 (diagnostic accuracy study), poor |
| Sufrin, 2012[21] United States Kaiser Permanente Northern California Residency Program, Kaiser Foundation Hospitals |
Retrospectivecohort 12 months data prior to and 90 days after IUD placement |
Women aged 14–49 years with Cu- or LNG-IUD placement with continuous membership with Kaiser system for given follow-up time (n=57,728) | 1. Same-day STI screening (n=5633) 2. Screening 1 day up to 8 weeks before placement (n=11,041) 3. Screening 8 weeks up to 1 year before placement (n=13,662) 4. No screening within 1 year (n=27,392) In models: Any screen: groups 1, 2, 3 Any prescreen: groups 2, 3 |
Risk of PID within 90 days placement Risk difference between groups (a priori margin of equivalence set: -0.006 to 0.006 based on prior studies of PID risk in IUD users | Risk of PID in sample: 0.0054 (95% CI 0.0048–0.0060) Risk of PID (95% CI): Group 1: 0.0044 (0.0029–0.0066) Group 2: 0.0099 (0.0082–0.0120) p < .001 comparing groups 1 and 2 Group 3: 0.0056 (0.0044–0.0070) Group 4: 0.0036 (0.0029–0.0044) p<.01 comparing groups 3 and 4 p < .0001 comparing groups 2 and 4 Adjusted risk differences (for age, race and ethnicity) were not significant comparing 1) no screen to any screen; 2) group 1 to any prescreen; 3) group 1 with group 2; 4) group 1 with group 4 Sensitivity analysis expanding PID diagnosis criteria did not change results Adjusted risk difference by age (younger than 26 years and 26 years or older) did not find differences between groups |
Large sample size in closed health care system Exposure: screen timing clearly defined and objective PID diagnosis criteria clearly described with sensitivity analyses performed Power calculation performed to detect risk difference between groups Screening performed according to CDC STD treatment guidelines Stratified by age |
Information regarding treatment for screening + results not reported Women excluded from l ogistic regression (n=1221) due to demographic information not available Multivariable analysis could not adjust for potential confounders that were not available in records Unclear if assessors of outcome blinded to exposure status Selection bias: screening determination based on risk factors which are the same as outcome risk factors |
II-2, fair |
| Campbell, 2007 [15] United States Source of funding NR |
Retrospective cohort Follow-up period not reported |
Women at urban, university-based clinic with Cu- or LNG-IUD placement (n = 194) | LNG-IUD (n=155) Cu-IUD (n=39) |
STI rates PID rates (by types of IUD, and by history of STI at time of IUD placement) by chart review |
History of STI before initiation: 31.7% STI diagnosed after initiation: 5.4% Rates of PID were similar before and after initiation (0.05%, 0.22%, respectively; p=.38) for all IUD users Rates of gonorrhea and herpes ½ infection were higher among Cu-IUD users (5.4% for both) than LNG-IUD users (0%, 0.7%, respectively) (p=.004, p=.04, respectively) Rates of PID did not differ between Cu-IUD (2.7%) and LNG-IUD (2.0%) users (p=.80); rates of endometritis did not differ between IUD types (5.4% vs. 1.3%, p=.13) Among women with history of STIs before initiation, rates of PID were similar to women with no history of STIs before initiation (1.7% vs. 2.4%, p=.79) but had higher rates of STIs after initiation (11.9% vs. 2.4%, p=.007) |
Groups similar at baseline, some potential confounders assessed PID diagnostic criteria defined Low attrition | Single site, small sample size No standard STI screening before placement and diagnosis criteria/testing/ treatment for STIs and PID not reported Did not assess sexual behavior, condom use Unclear follow-up time Power calculations not performed All data from chart review; outcomes may be underestimated if women sought care from other sites Coding of exposure and outcome done at same time; no blinding to exposure status |
II-2, poor |
| Morrison 2007 [18] Kenya, Zimbabwe, Jamaica, United States, Uganda, Thailand USAID, FHI |
Secondary data analysis from 4 data sets (diagnostic accuracy study of algorithms validated with 2 additional data sets) | Family planning clinics in Kenya, Zimbabwe, Jamaica, US for development of algorithms (samples ranged from 615 to around 1400 women); Thailand (n=1525), Uganda (n=1731) for validation (all moderate to high STI prevalence) excluding women with cervical mucopus, cervical/vaginal ulcer or clinical diagnosis PID | Women grouped into low (score 0), moderate (score 1–2), and high risk (score 3+) for cervical infection based on: Historical variables: age under 25 years, not living with partner, low education for the population, bleeding between periods, recent condom use, number of sex partners Clinical signs: cervical abnormality (includes cervical edema, erythema or friability, trawberry cervix) |
Likelihood ratio (aim to identify ideal algorithm with low LR < 0.75 for low risk of current cervical infection group and high LR > 2.0 for high risk of current cervical infection group) | Clinical signs did not improve the history-based algorithm—did not improve identification of low vs. high risk women—in original 4 countries Validation (historical only):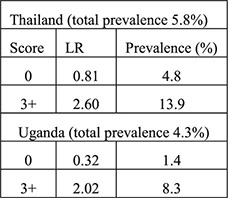 Validation (historical plus clinical): 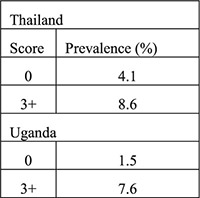 Algorithms performed differently in certain countries when certain variables were included (e.g., ethnicity, education) |
Validated in diverse populations at family planning clinics: generalizable Risk factors assessed by interview not records | Results limited by existing data sets, unclear who performed interviews, how and when GC/CT tested | II-2, fair |
| Morrison, 1999 [19] Kenya Source of fundingNR |
Secondary data analysis from prospective cohort 4-month follow-up with 1-month visit | Women with IUD placement and baseline HIV testing (n=615) with endocervical specimen testing for chlamydia antigen test and gonorrhea culture (n=580) | Women with + testing Women with – testing Algorithms: 1a. (any): age ≤ 24 years, single/divorced/widowed,≥2 sex partners in last 3 months, STD symptoms in past year 1b. (any risk from 1a or any of following): abnormal vaginal or cervical discharge, ulcerations, pelvic/adnexal/cervical motion tenderness 2. (any): age <20 years, cervical discharge, age 20–24 years and≥2 sex partners or no condom use in last 3 months, age > 25 years and ≥2 sex partners and no condom use in last 3 months 3a. (any): Age ≤ 24 years, single/divorced/widowed, Luhya ethnicity, live births ≤ 2 3b: (sum of ≥2): age ≤ 24 years (1), single/divorced/widowed (2), Luhya ethnicity (2), live births ≤ 2 (1) |
PID rates Sensitivity Specificity PPV NPV PLR NLR |
Among women with cervical infection at 1 month (n=32, 5.5%), PID rate 3.1% Among women without infection at 1 month (n=548) PID rate 0.4%; no p value reported 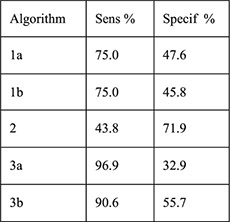 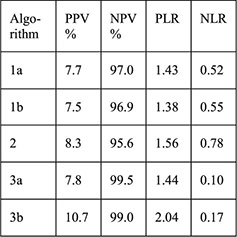
|
Large sample size Screening tests described with credible reference PID diagnosis criteria defined Low attrition (5%) Risk factors assessed by interview not records |
Laboratory screening not performed at time of IUD initiation No statistical testing comparing women with infection and women without infection and risk of PID Treatment for cervical infection not reported Algorithms 3a and 3b calculated for study population and not generalizable |
II-2 (diagnostic Accuracy study), poor |
| Faundes, 1998 [20] Brazil Population Council's Robert H. Ebert Program for Critical Issues in Reproductive Health and Population; John D. and Catherine T. MacArthur Foundation; UNDP/UNFPA/WHO/World Bank Special Program of Research, Development and Research Training in Human Reproduction |
Cross-sectional and follow-up study without a comparison group 1 month | Women attending family planning clinic for contraception initiation, screened for chlamydial or gonococcal infection by history/clinical signs and laboratory screening (CT antibody and GC culture) (n=407) | CT positive by laboratory screening (n=27, 6.7%) CT negative and GC negative (n=380) Presumptive clinical diagnosis of GC or CT infection: history of multiple partners, purulent cervical secretion, hyperemia, bleeding of cervix at touch or pelvic pain during bimanual exam (n=29); no IUDs inserted Presumptive clinical diagnosis negative (n=378) |
Correlation of demographic and history variables with CT infection Findings on pelvic exam (pain, vulvar hyperemia, inguinal lymph node, vulvar lesions, vaginal or cervical hyperemia, excessive or foul smelling discharge, purulent cervical mucus, cervical bleeding at touch Sensitivity, specificity, false positive and false negative of presumed clinical diagnosis |
No correlation of race, education, coitarche, use of condoms, lifetime partners (1 vs. more than 1) STI history to CT infection. Longer years of current partnership associated with higher prevalence of CT (χ2=13.0, p=.0046). No significant differences in any exam findings between CT+ and CT− groups (p values all >.1). Presumptive clinical diagnosis had 7.4% sensitivity for CT, 92.8% specificity, 93.1% false positive and 6.6% false negative 19/327 IUD acceptors were CT positive 2/19 were diagnosed with PID within 2 weeks and treated; one had IUD removed and one did not 17/19 were treated at 1 month and did not have PID |
No discussion of why CT associated with longer partnership: suspicious result Outcome assessment done by investigator not involved in interviews Risk factors assessed by interview not records All CT positive were treated |
Single site Small sample size. CT diagnosed by antibody not culture: potential for false positives Symptoms, exam and CT results only available for 261 women CT negative PID diagnosis criteria not clearly defined Follow-up unclear for CT negative women |
II-3, fair |
Abbreviations: NICHD=Eunice Kennedy Shriver National Institute of Child Health and Human Development; LNG=levonorgestrel; Cu=copper; IUD=intrauterine device; STI=sexually transmitted infection; NAAT=nucleic acid amplification test; PPV=positive predictive value; NPV=negative predictive value; NLR=negative likelihood ratio; Sens=sensitivity; Specif=specificity; CI=confidence interval; CDC= Centers for Disease Control and Prevention; STD=sexually transmitted disease; PID=pelvic inflammatory disease; EC=emergency contraception; EMR=electronic medical record; LTFU=loss to follow-up; PLR= positive likelihood ratio; USAID=United States Agency for International Development; FHI=Family Health International; LR=likelihood ratio; GC=gonorrhea; CT=chlamydia; NR=not reported; UNDP=United Nations Development Programme; UNFPA=United Nations Population Fund; WHO=World Organization.
