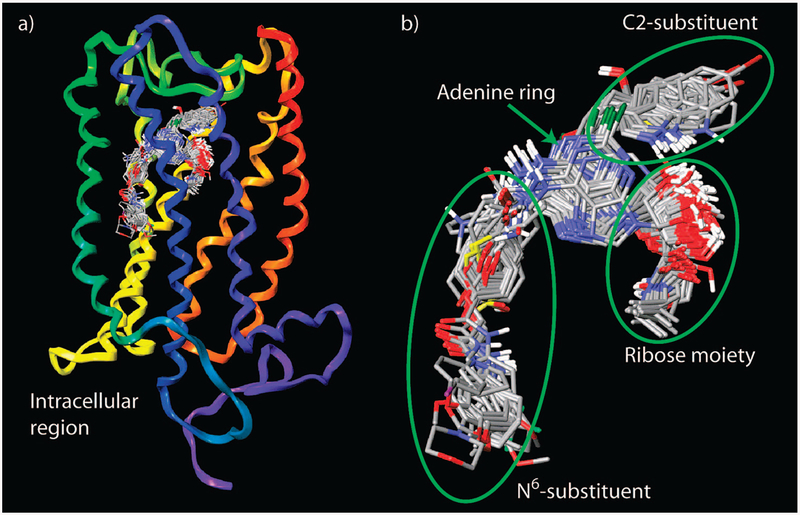
Figure 1.
(a) Overlay of all docked ligands at the A2B AR. (b) Structural alignment of the ligands extracted from the ligand–receptor models. The structure of the A2B AR is colored by residue position: N-terminus and TM1 in orange, TM2 in ochre, TM3 in yellow, TM4 in green, TM5 in cyan, TM6 in blue, TM7 and C-terminus in purple.

