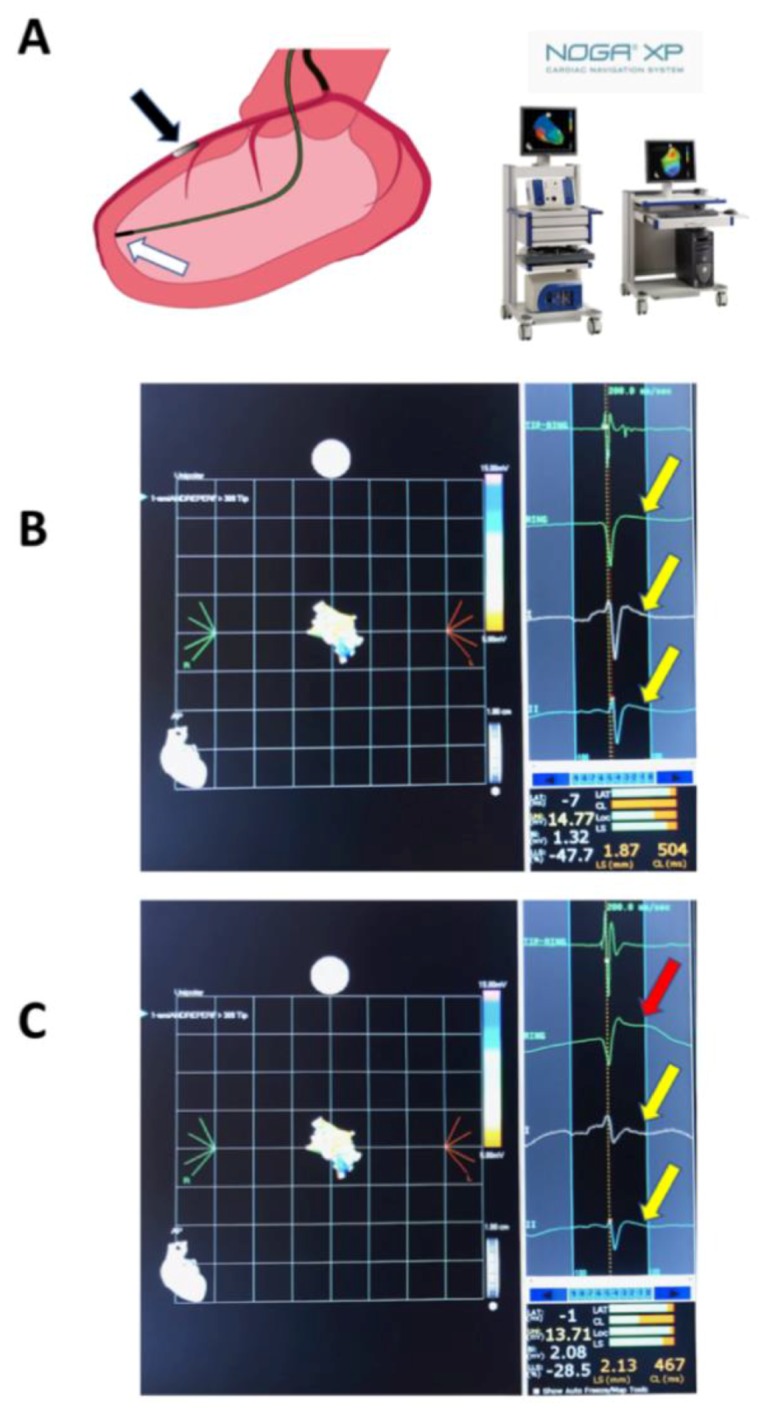
Figure 1.

Schematic of the interventional procedure and intracardiac ECG. (A) NOGA mapping catheter in the left ventricular cavity touching a fixed endocardial surface point of the ischemic distal anterior wall (white arrow), measuring the endocardial voltage signals and intracardiac ECG; intracoronary balloon in the mid-left anterior descending coronary artery (black arrow), after the origin of the second diagonal branch) (left panel). NOGA equipment enabling online recording of the electrophysiological parameters, and intracardiac and surface ECG (right panel); (B) NOGA single point mapping with surface and intracardiac ECGs before the intracoronary balloon occlusion. Note the iso-electric ST-segment in both (yellow arrow); and, (C) Intracardiac ST-elevation during intracoronary balloon occlusion (red arrow), and the iso-electric ST-segment in surface ECG (yellow arrow).
