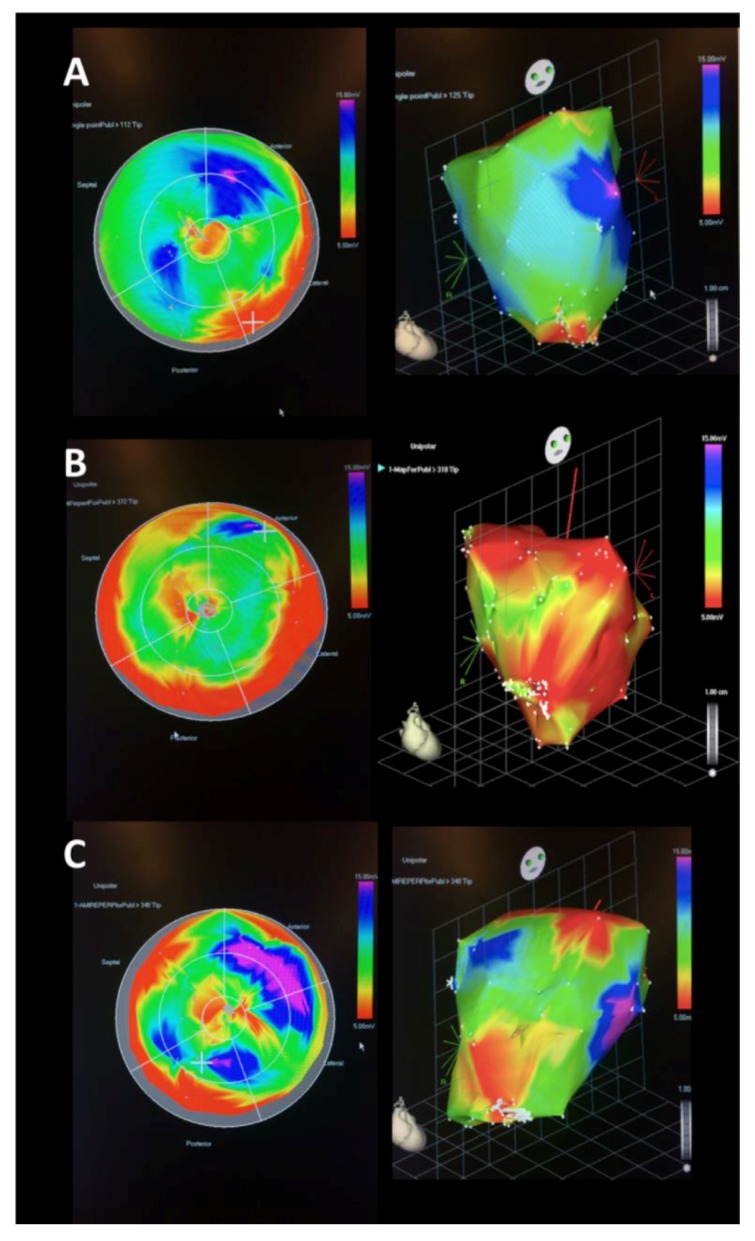
Figure 3.
Representative NOGA endocardial surface mapping of unipolar electrical potential (mV) at the end of the AMI procedures. Representative image of an animal in group IPC-AMI (A), group AMI, (B) and group AMI-PostC (C). Left: 2D polar maps derived from the 3D maps (Right panel). Voltage values are color-coded, and represent myocardial viability: According to color scale, red: non-viable myocardium, pink and blue viable areas, green and yellow: reduced viability demonstrated. Voltages shown at the marginal edge of the polar map (= close to valvular plane) reflect the naturally low conductivity of the tissue separating atrium and ventricle and are not indicative of ischemic damage. Right: 3D representation of the mapped endocardium, with the apex of the ventricle pointing towards the viewer. There is a visual difference in the size of the apical damaged zone in the three groups, with largest viable zone in the IPC-AMI group.

