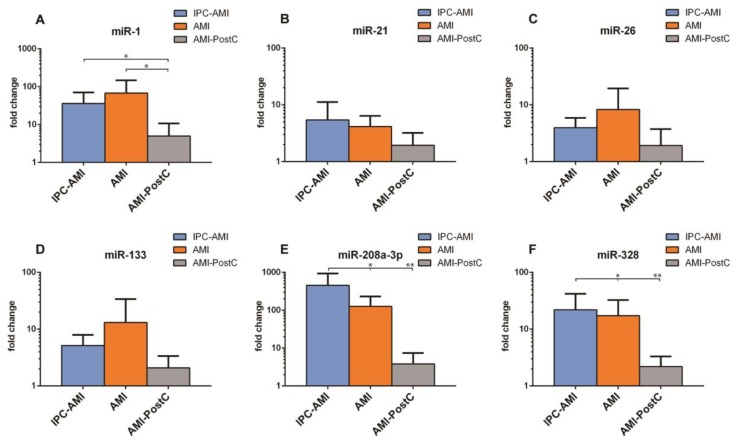
Figure 6.
Plasma levels of (A) miR-1, (B) miR-21, (C) miR-26, (D) miR-133, (E) miR-208a-3p and (F) miR-328 in groups. IPC-AMI, AMI and AMI-PostC, quantified by qPCR, immediately after the 60 min reperfusion period. Fold changes (y axis) are relative to baseline values of the individual animals. * p < 0.05, ** p < 0.01.

