
Figure 5.
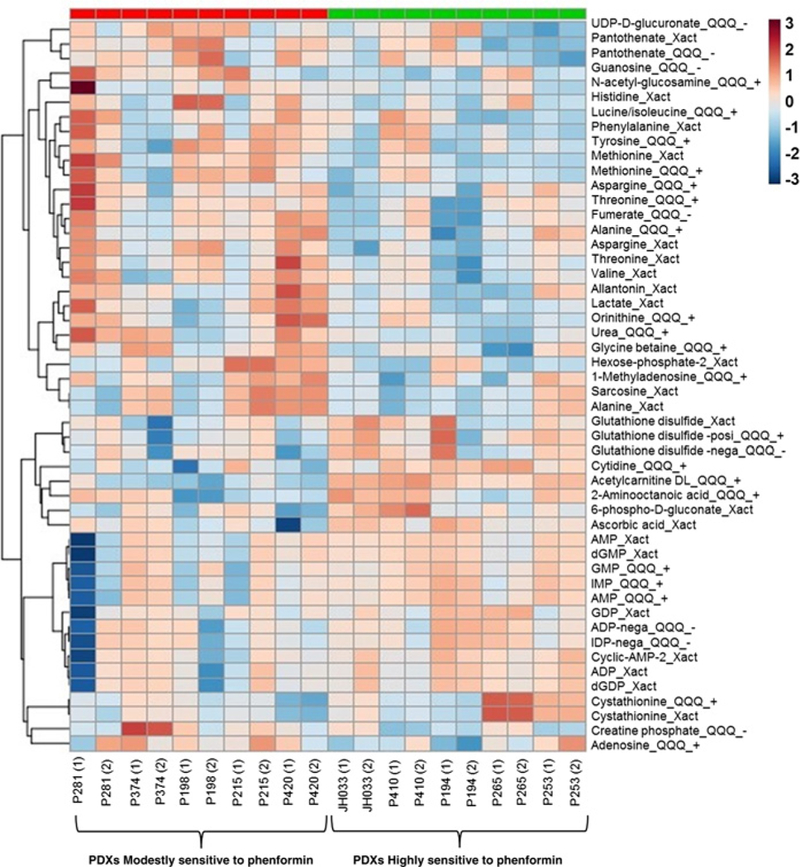
Heatmapshowing expression levelsof top 50 metabolites in PDXs that were modestly sensitive (<30% reduction of tumor growth compared with vehicle treatment) or highly sensitive (>30% reduction of tumor growth compared with vehicle treatment) to phenformin treatment. Metabolites were quantitated in the baseline tumors by LC/MS (details on LC/MS are provided in Materials and Methods). “Xact” indicates the metabolite was analyzed using an Exactive high-resolution mass spectrometer (Thermo Fisher Scientific) in negative mode, “QQQ_+” and “QQQ_−“ indicate that metabolite was analyzed using triple quad mass spectrometry analysis (both from Thermo Fisher Scientific) in positive and negative mode, respectively. Frequently, the same metabolites were measured by both methods, in which case the results from both methods are presented and generally agree.