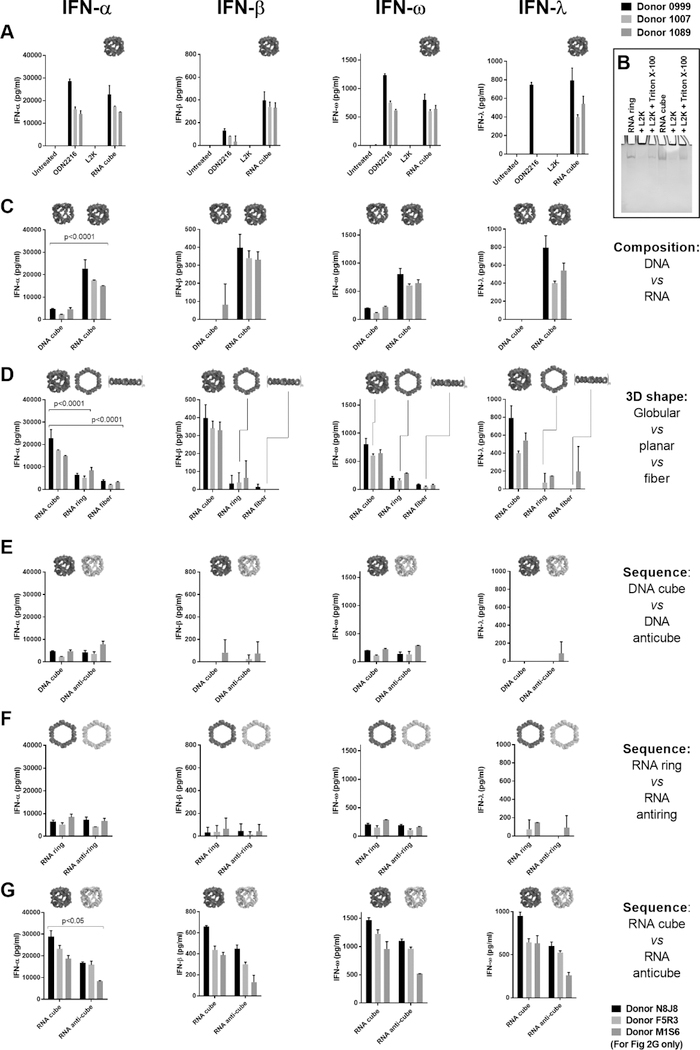
Figure 2.
Complexation with lipofectamine, material type, and 3D structure are critical for the NANP induction of interferon responses. Graphs show the production of IFNs by PBMCs after the delivery of NANPs with Lipofectamine 2000 (L2K). (A) Delivery of RNA cubes stimulates the production of all IFNs assayed. ODN 2216 is a positive control. (B) Ethidium bromide total staining native polyacrylamide gel electrophoresis (PAGE) results demonstrate complexation and retention of NANPs’ structural integrity upon interaction with L2K; NANPs’ complexation with L2K prevents them from entering the gel, while detergent treatment releases NANPs and restores their electrophoretic mobility. (C) RNA cubes induce greater IFN production by PBMCs than DNA cubes. (D) Comparison of RNA cubes, rings, and fibers shows that cubes are the most immunostimulatory. (E–G) Reversing the nucleic acid sequences for (E) DNA cubes and (F) RNA rings does not affect IFN induction. However, RNA cubes are stronger inducers of IFN than (G) anti-cubes. Corresponding 3D models of NANPs are shown in-line with IFN data. Each bar represents data from a single donor, showing a mean response and standard deviation (n = 3 donors). For panels A–F, donor numbers are 0999, 1007, and 1089; for panel G, donor numbers are N8J8, F5R3, and M1S6. Statistical analysis was performed by one-way ANOVA. The differences are significant for all INF in panels C, D, and G with the same p values as for INFα.

