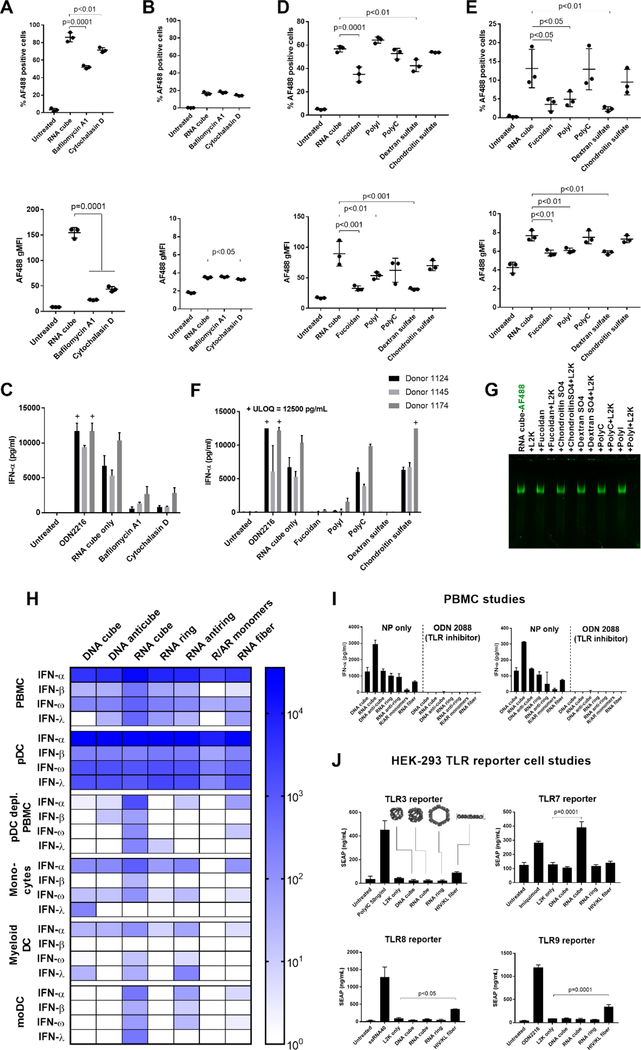
Figure 5.
Cellular and molecular mechanisms involved in the immune recognition of NANPs. The study involved 12 donors in total. After pretreatment with the inhibitors bafilomycin A1 and cytochalasin D, (A) monocytes and (B) lymphocytes were analyzed by flow cytometry for the percentage of cells that took up AF488-labeled RNA cubes (upper plots) and the number of particles taken up as represented by MFI (lower plots). A total of three donors (1083, 1094, and 1150) were tested, with each dot representing data from an individual donor. Phagocytosis and endosomal acidification are essential for NANP internalization by monocytes. (C) PBMCs from three donors treated with bafilomycin A1 and cytochalasin D did not produce an IFN-α response when exposed to unlabeled RNA cubes. (D, E) PBMCs were pretreated with several scavenger receptor inhibitors [fucoidan, polyinosinic acid (polyI), and dextran sulfate] and controls [polycytidylic acid (polyC) and chondroitin sulfate] before being exposed to AF488-labeled RNA cubes. (D) Monocytes and (E) lymphocytes were analyzed by flow cytometry. Fucoidan and dextran sulfate blocked the uptake of RNA cubes in monocytes (D), whereas fucoidan, polyI, and dextran sulfate blocked uptake in lymphocytes (E). A total of three donors (0794, 1155, and 1157) were tested, with each dot representing data from an individual donor. (F) PBMCs were treated with scavenger receptor inhibitors and then treated with unlabeled RNA cubes and assayed for IFN-α production. (G) Native PAGE showing that none of the inhibitors induced release of L2K complexation with AF488-labeled RNA cubes. “+ ULOQ” refers to the IFN levels above the assay’s upper limit of quantification. Statistical analysis was performed by one-way ANOVA with Dunnett’s post-test, comparing all groups to the RNA cube alone (single asterisk, p < 0.05; double asterisks, p < 0.01; triple asterisks, p < 0.001; quadruple asterisks, p = 0.0001). (H–J) Cells from major DC subsets [plasmacytoid DCs (pDCs), monocytes, and myeloid DCs] were purified from whole blood by negative selection, treated with NANPs, and assayed for IFN production (H). Each box represents an averaged value across separate groups of three donors. Plasmacytoid DCs were depleted from PBMCs (pDC-depleted PBMC) by positive selection, and the resulting cells were treated with NANPs. Purified monocytes were differentiated into monocyte-derived DCs, treated with NANPs, and tested for IFN induction. Complete data sets are presented in Figure S16. (I) NANPs were complexed with L2K and added to PBMCs either alone or with a pan-TLR inhibitor, ODN 2088. Production of IFN-α (left) and IFN-ω (right) was measured by multiplexed ELISA. (J) HEK-293 reporter cell lines overexpressing TLR3, TLR7, TLR8, or TLR9 were used to estimate the recognition of NANPs. Known agonists to the respective TLRs were used as positive controls: poly(I:C) for TLR3, Imiquimod for TLR7, ssRNA40 for TLR8, and ODN 2216 for TLR9. Only RNA cubes activated the SEAP reporter gene in the TLR7-over-expressing cell line. Activation of the reporter gene by RNA fibers was observed in TLR3-, TLR8-, and TLR9-over-expressing cells (possibly due to the expression of endogenous TLR3 in all cell lines). Each bar in panels H–J shows a mean response and a standard deviation (n = 3). Statistical analysis was performed by one-way ANOVA with Dunnett’s post-test, comparing all groups to the “L2K only” results.

