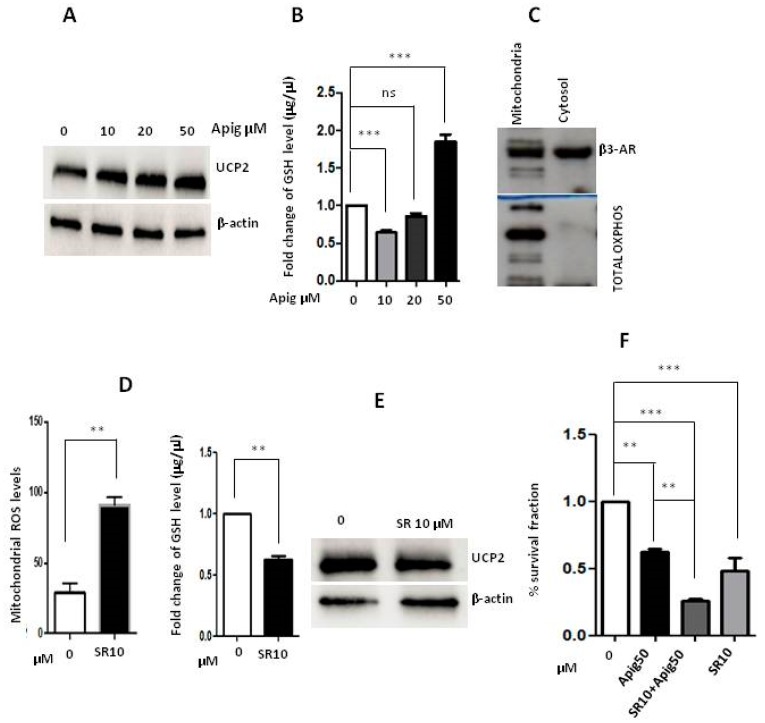
Figure 3.
(A) Western Blot analysis of apigenin (10-20-50 μM) effect on UCP2 expression, with β-actin as loading control; (B) Measurement of reduced glutathione levels (GSH) after 24 h of treatment with apigenin; (C) WB analysis of β3-AR on mitochondria proteins; (D) Mitochondria mtROS measurement after treatment with β3-AR antagonist, SR59230A, at the concentration of 10 μM and measurement of GSH levels at the same time and concentration of SR59230A; (E) WB analysis of UCP2 expression after treatment with β3-AR antagonist SR59230A with β-actin as loading control; (F) MTT survival experiment with double treatment with SR59230A (10 μM) and apigenin (50 μM). SR10: SR59230A 10 μM, Apig50: apigenin 50 μM, ns: not significant. P values for treatments: ** p < 0.01 and *** p < 0.001.

