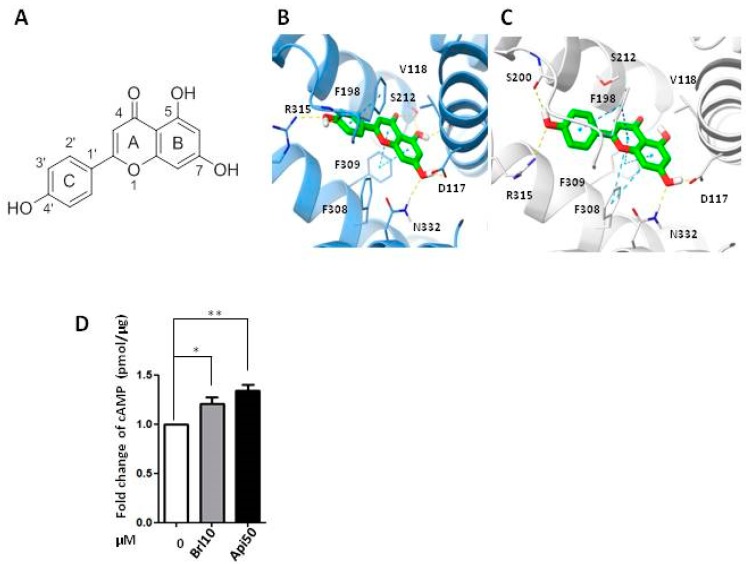
Figure 5.
(A) Structure of apigenin. (B,C) Predicted binding mode of apigenin in the β3-AR binding pocket of (B) HM1 and (C) HM2; (D) Measurement of cAMP concentration after 30 min of treatment with BRL37344 (10 μM) and apigenin (50 μM). Brl10: BRL37344 10 μM, Apig50: apigenin 50 μM. p values for treatments: * p < 0.05 and ** p < 0.01.

