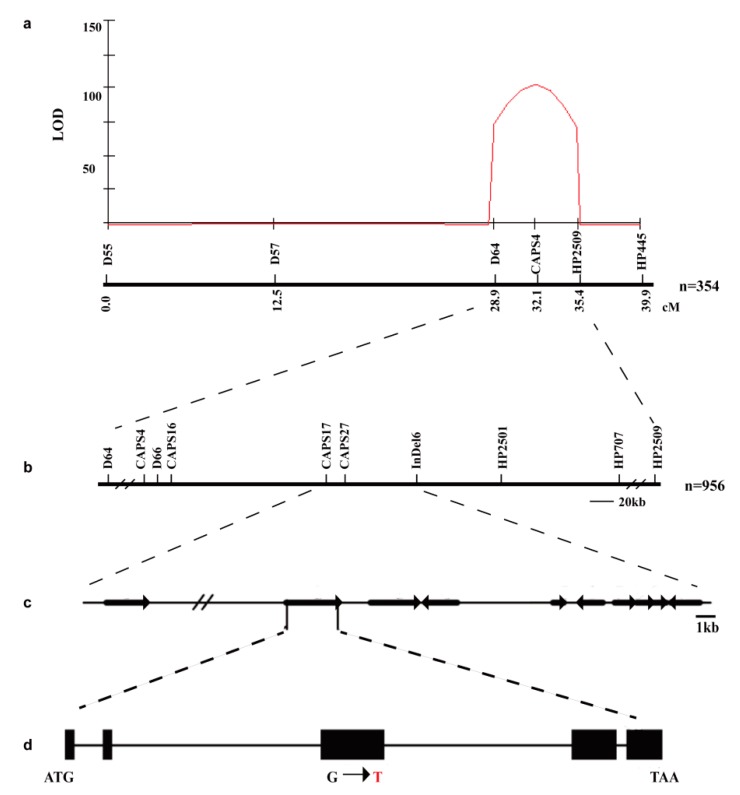
Figure 4.
Map-based cloning of ei locus. (a) The genetic map of ei on chromosome 2, mapped using 354 F2 individuals and six polymorphic markers. (b) The ei locus was fine-mapped to the interval between markers CAPS17 and InDel6. (c) Predicted genes in the region encompassing the ei locus. The arrows indicate the direction of transcription. (d) Gene structure and the mutation site. The black rectangles and black line indicate exons and introns, respectively. The red letter represents the mutation base in mutant P502.

