Figure 7.
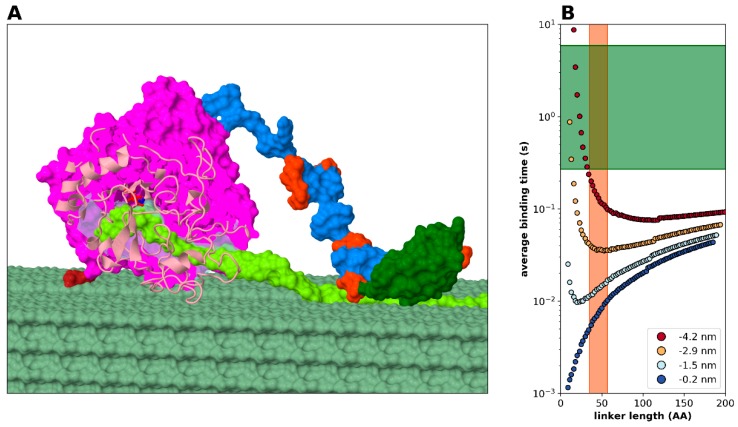
Cellulase: a model processive enzyme. (A) Model of the Cel7A cellulase based on the structure PDB 8cel for the catalytic domain (CD) and PDB 2mwk for the cellulose-binding domain (CBM). The CD is purple with the cellulose tunnel shown in transparent blue. One glycosylation of the CD is visible in dark red. Further elements marked are the two catalytic amino acids (red and blue stick-and-ball), the linker region (blue with orange mannose glycosylation), the CBM (dark green), and the cellulose sheet (pale green) of which one fibril (yellow-green) is being processed. The sequence and glycosylation is based on UniProt P62694. (B) Statistical kinetic modelling considering geometry (size) and binding of the linker to CD shows binding times characteristic of this system. The green area represents typical catalytic times for Cel7A cellulase family (Table S3), whereas the red area marks typical linker region lengths (Figure S2). The four curves correspond to various values of the linker region’s partial binding to the CD, which results in it emerging from the CD at different points (see color mark). If we consider the beginning of the CD domain as the origin of the coordinate system and the cellulose filament moves along the X axis, and assume no binding between the linker and the CD, then free end of the linker region reaches −4.2 nm (red in color scale). When the largest portion of the linker is bound to the CD, the starting point of the free linker end is at zero (blue in color scale). Yellow and light blue colors represent intermediate back-binding cases, with −2.5 and −1.5 nm starting points, respectively.

