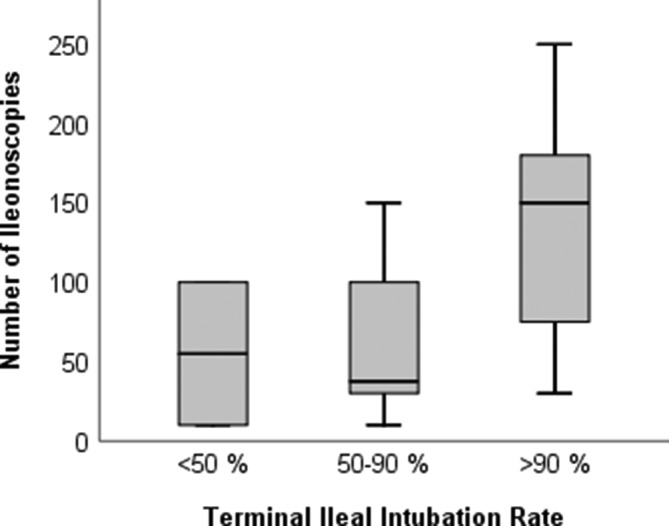
Figure 2.

Boxplots with TII rate ((1) >90% (n=13), (2) 50%–90% (n=13), (3)<50% (n=2)) vs number of ICs of the trainees who finished their training. Whiskers depict maximum and minimum number of colonoscopies. ICs, ileocolonoscopies; TII, terminal ileal intubation.
