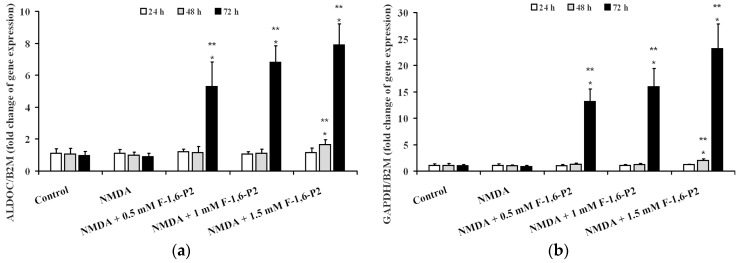
Figure 8.
Effects of F-1,6-P2 on gene expression of aldolase (ALDOC) and glyceraldehyde-3-phosphate dehydrogenase (GAPDH) in NMDA-treated OHSC. OHSC were challenged with 30 μM NMDA for 3 h and then incubated without and with increasing concentrations of F-1,6-P2 (0.5, 1 and 1.5 mM) for different times (24, 48 and 72 h). Control OHSC were incubated for the same time intervals, with no prior NMDA treatment or F-1,6-P2 addition. Semi-quantitative ALDOC (a) and GAPDH (b) expressions were determined in cell extracts, relatively to the housekeeping gene β-2-microglobulin (B2M). Histograms are the mean of 6 different OHSC preparations. Standard deviations are represented by vertical bars. * Significantly different from corresponding time of control OHSC, p < 0.001. ** Significantly different from corresponding time of NMDA-challenged OHSC with no F-1,6-P2 supplementation, p < 0.001.

