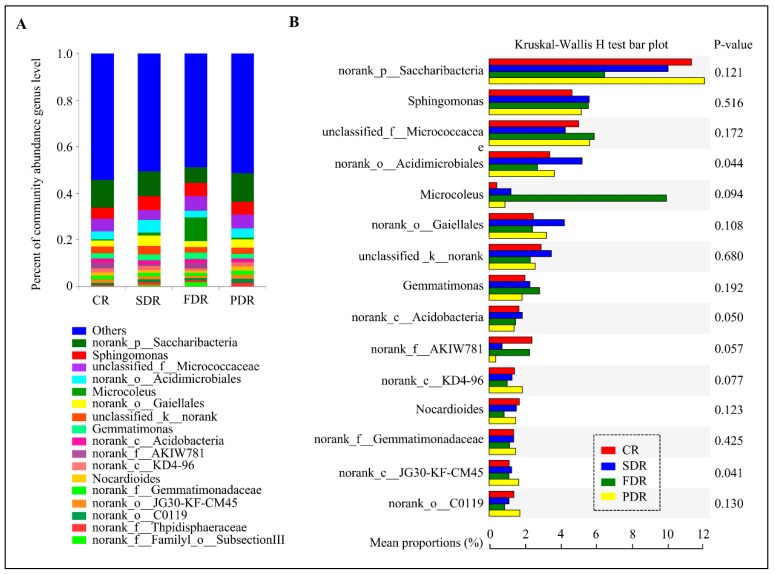
Figure 3.
Microbial community structure and diversity in drought-treated and untreated peanut rhizosphere. (A) Percent of microbial community abundance at the genus level in four soil groups in peanut rhizosphere. The relative abundance is calculated by averaging the abundances of duplicate samples. (B) Microbial community diversity in drought-treated and untreated peanut rhizosphere via Wilcoxon rank-sum test bar plot. Left image represents the proportions of various genera in four soil groups. Right image represents the difference between proportions in 95% confidence intervals. The names of “norank” and “unidentified” are all unidentified species obtained directly from database via sequence alignment.

