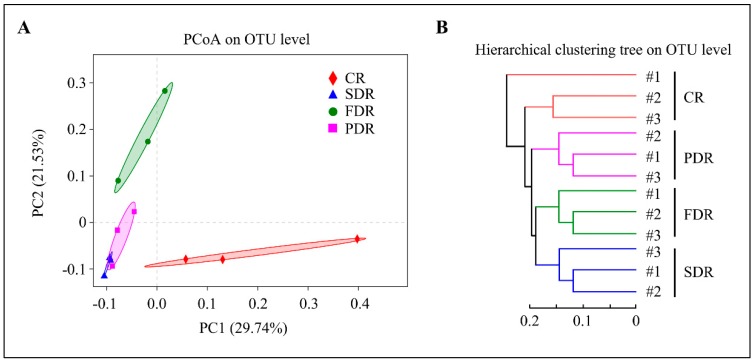
Figure 4.
Beta diversity analysis. (A) Principal co-ordinates analysis (PCoA) analysis. The same color points belong to the same soil group, and the same soil group points are marked by ellipses. The samples belonging to the same soil group are closer to each other and the samples from different soil groups are farther apart. (B) Hierarchical clustering is clustered according to groups’ similarity. The branch length among soil groups represent the degree of similarity among the four soil groups. #1, #2 and #3 represent three duplicate samples in per soil group.

