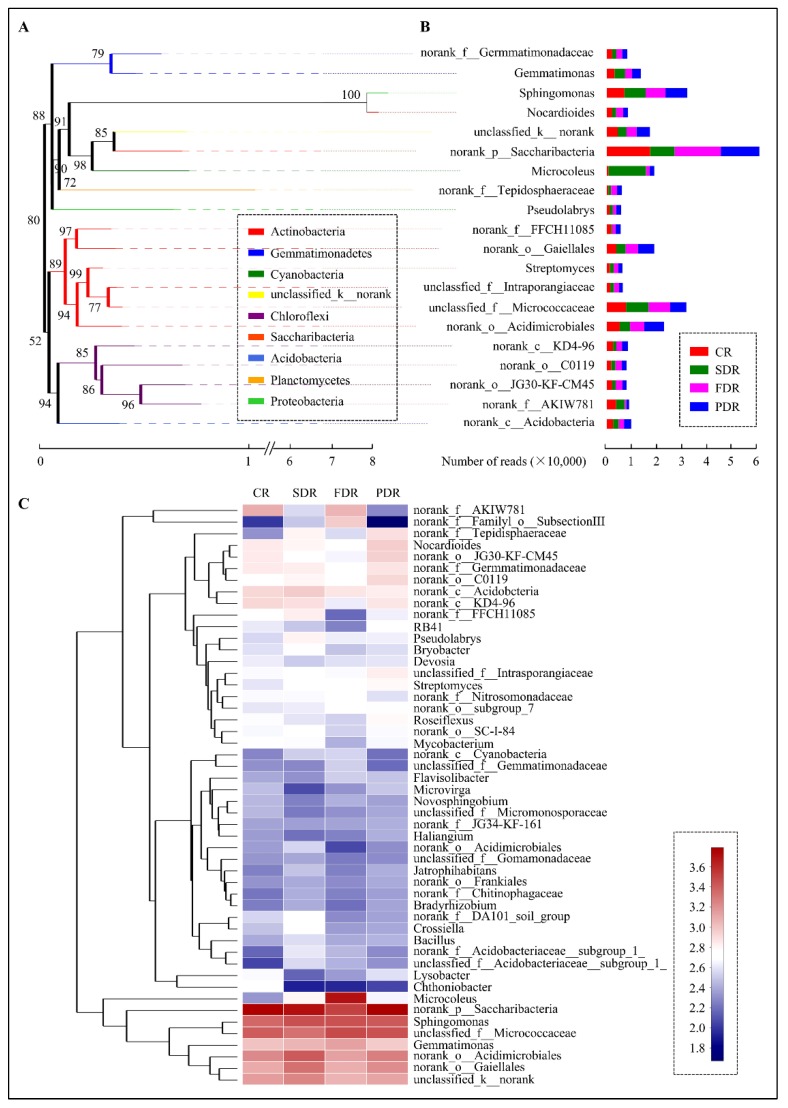
Figure 5.
Taxonomic analysis through phylogenetic tree and heat map. (A) A phylogenetic tree showing the relationship among drought-treated and untreated soil groups. The phylogenetic tree was constructed on the basis of 16S rRNA gene sequences. Bootstrap values were obtained from a search with 1000 replicates and are shown at the nodes. Species names and proportions in four soil groups showing in the right. (B) The heat map visualization with hierarchical clustering of the top 50 most abundant genera was generated according to the similarity among their constituents, and were arranged in a horizontal order according to the clustering results. (C) In the figure, red represents the more abundant genera in the corresponding soil group, and blue represents the less abundant genera. The names of “norank” and “unidentified” are all unidentified species obtained directly from database via sequence alignment.

