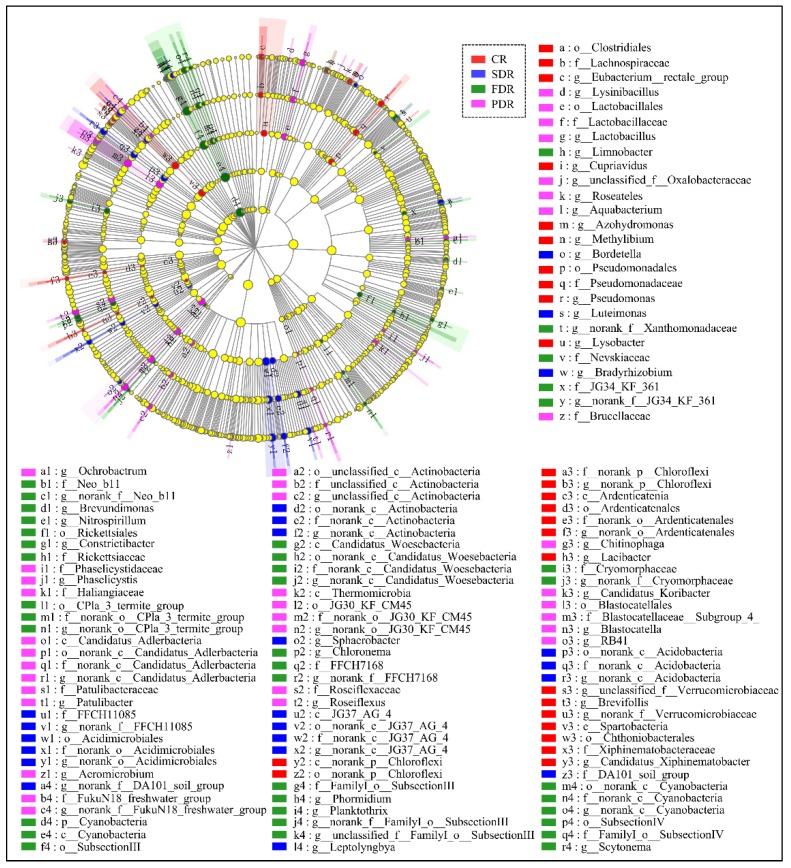
Figure 6.
Cladogram showing specific phylotypes of peanut rhizosphere responding to drought stress. Indicator bacteria with linear discriminant analysis (LDA) scores of 3 or greater in microbial communities associated with soil from drought-treated and untreated soil groups. Circles indicate phylogenetic levels from phylum to genus (from the inner circle to the outer circle). The diameter of each circle is proportional to the abundance of the group. The names of “norank” and “unidentified” are all unidentified species obtained directly from database via sequence alignment.

