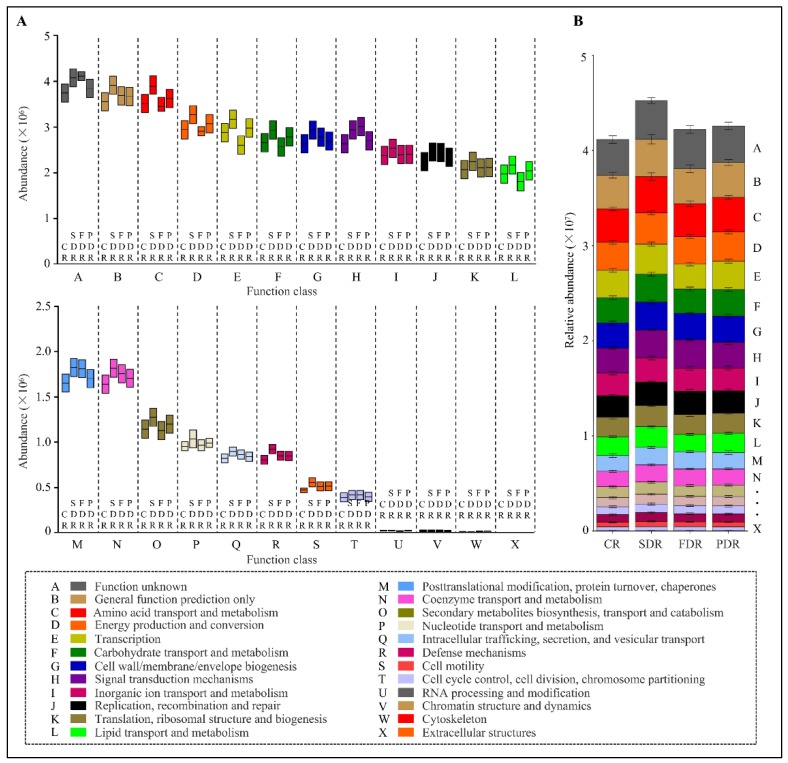
Figure 7.
The microbial functional features in three drought-treated soil groups via Cluster of Orthologous Groups (COG) analysis. (A) Box-plot showing the relative abundance and diversity of various functional groups in drought-treated and untreated soil groups. (B) Bar chart showing the relative abundance and diversity of functional groups in drought-treated and untreated soil groups. The relative abundance is calculated by averaging the abundances of duplicate samples. Different COG groups were displayed in different colors in the bottom.

