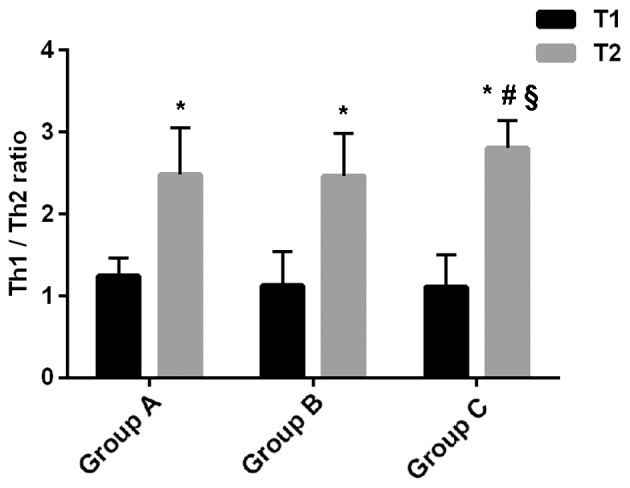
Figure 1.

Ratio of Th1/Th2. At T1, there was no significant difference in Th1/Th2 ratio among the three groups (P>0.05). At T2, Th1/Th2 ratios were significantly higher in all three groups, compared with T1 (*P<0.05). At T2, there was no significant difference in Th1/Th2 ratio between groups A and B (P>0.05), whereas the Th1/Th2 ratio in group C was significantly higher than those in groups A (#P<0.05) and B (§P<0.05). Th cells, T helper cells.
