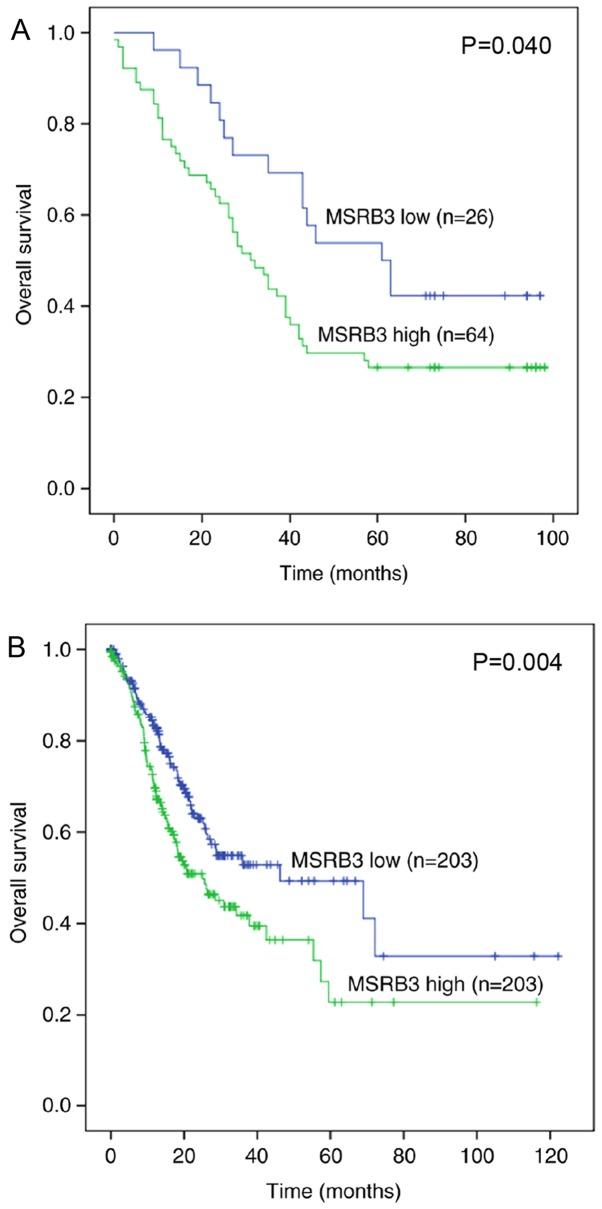
Figure 2.
Kaplan-Meier survival curves for MSRB3 expression level in patients with GC. (A) OS time curves for patients with GC (n=90) expressing high or low levels of MSRB3. Patients with high MSRB3 expression exhibited a significantly shorter OS time compared with those with low MSRB3 expression (P=0.040). (B) OS time curves for patients with GC (n=442) from The Cancer Genome Atlas database. Patients with high MSRB3 expression level exhibited a significantly shorter OS time compared with patients with low MSRB3 expression level (P=0.004). GC, gastric cancer; MSRB3, methionine sulfoxide reductases B3; OS, overall survival.

