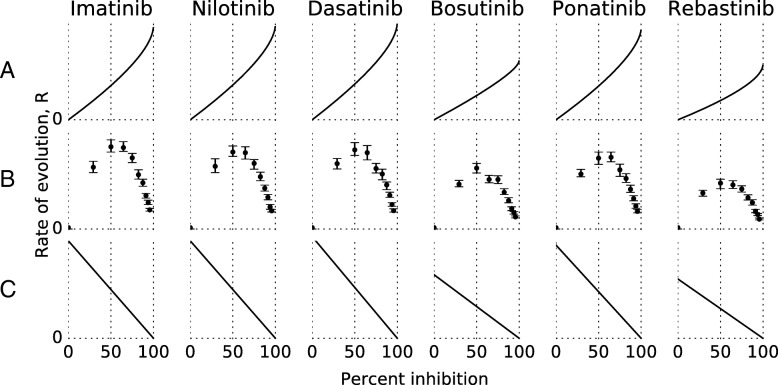
Fig. 2.
The rate of evolution varies with inhibition. The y-axis is in arbitrary units and scale is consistent within rows but not comparable between rows. a Pure fitness effects, with a constant reproduction rate. Derived from Moran model [42], see Eq. 7. b Our model. The inverse of median from simulation with the errorbars showing a 95% confidence interval. The slightly jagged appearance comes from random variation in the stochastic simulations and from having fewer data points than in a or c. c Pure reproduction rate effects, i.e. simulations where any resistance mutation is guaranteed to be fixed

