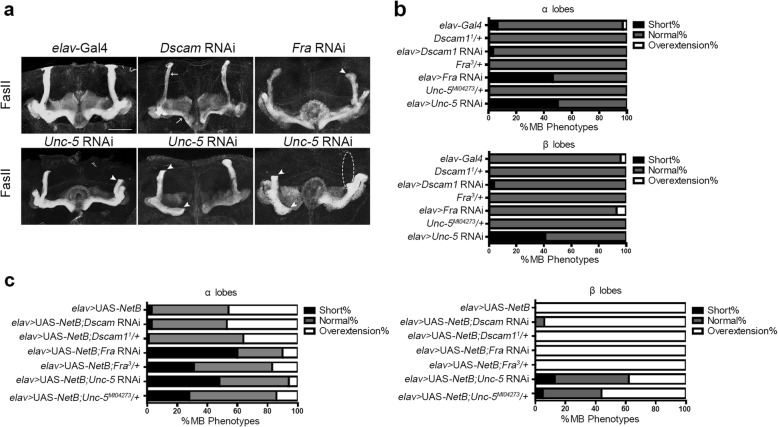
Fig. 3.
Receptors Fra and Unc-5 show genetic interaction with NetB in MB lobe extension. a Receptors Dscam, Fra and Unc-5 are involved in MB development. Dscam RNAi MBs displayed thin α/β lobes with normal length compared with control MBs; Fra RNAi MBs displayed short α lobes (arrowhead); Knock-down of Unc-5 caused both short (arrowhead) or even missing (dashed lines) α/β lobes. b The percentage of brain hemispheres with short α/β lobes (elav-Gal4, n = 30; elav > Dscam RNAi, n = 30; elav > Fra RNAi, n = 28; elav > Unc-5 RNAi, n = 34; ***p < 0.001; Dscam11/+, n = 25; Fra3/+, n = 30; Unc-5MI04273/+, n = 30). c Receptors Fra and Unc-5 show genetic interaction with NetB. The lobe phenotypes were classified as short, normal or overextension, and the quantification was shown as the percentages of brain hemispheres in each category. The percentage of overextended α lobes was significantly reduced in elav > UAS-NetB; Unc-5 RNAi (or Unc-5MI04273/+) and in elav > UAS-NetB; Fra RNAi (or Fra3/+) compared with NetB OE (elav > UAS-NetB); The percentage of overextended β lobes was significantly reduced only in elav > UAS-NetB; Unc-5 RNAi (or Unc-5MI04273/+) lines. (elav-Gal4/Y; UAS-NetB/+, n = 30; elav-Gal4/Y; UAS-NetB/+; Unc-5 RNAi/+, n = 48; elav-Gal4/Y; UAS-NetB/ Unc-5MI04273, n = 36; elav-Gal4/Y; UAS-NetB/+; FraRNAi/+, n = 24; elav-Gal4/Y; UAS-NetB/Fra3, n = 36; elav-Gal4/Y; UAS-NetB/+; /Dscam RNAi, n = 30; elav-Gal4/Y; UAS-NetB/Dscam11, n = 34; p < 0.0001). Significance was determined by Fisher’s exact test. Scale bars: 50 μm

