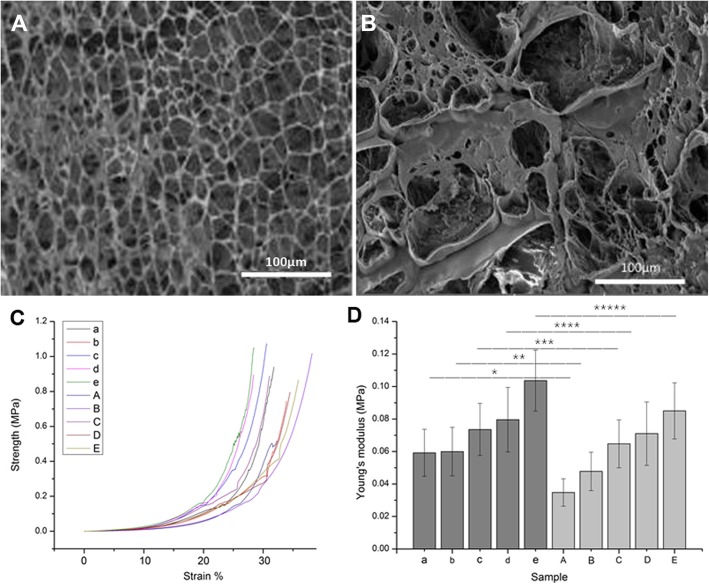
Fig. 4.
SEM images of the hydrogel micro-structure and Mechanical property test in the control and experimental groups. a SEM images of the hydrogel micro-structure in the control group. b SEM images of the hydrogel micro-structure in the experimental group. c Compressive-tensile strength curve. d Young’s modulus. a, b, c, d, e represent the stress-strain diagram and Young’s modulus of the control group a, b, c, d, e, and A,B,C,D,E represent the stress-strain diagram and Young’s modulus of the experimental groups. *,**,***,****: p < 0.05

