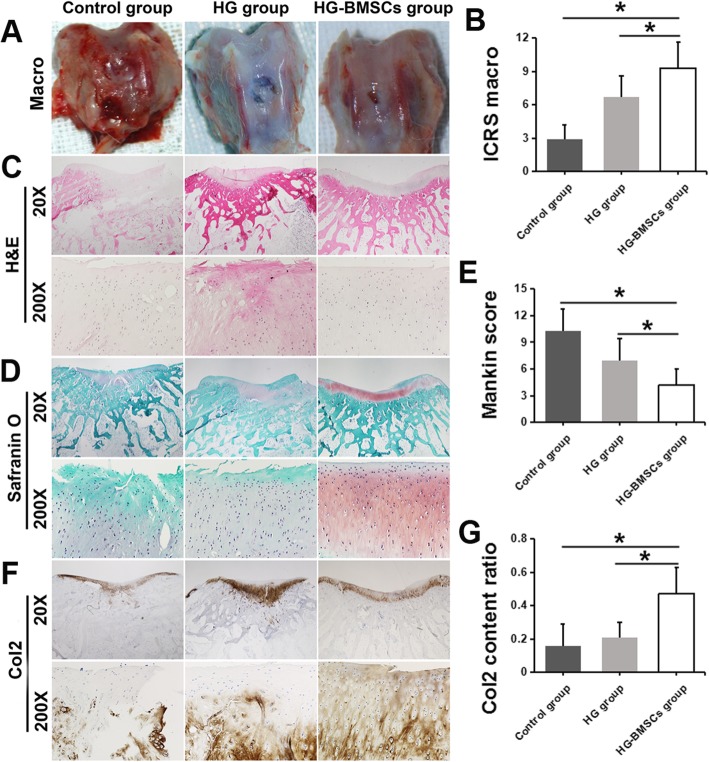
Fig. 8.
Macro and histological evaluation of the osteochondral defect healing in the control, HG and HG-BMSCs groups at 12 weeks after surgery. a The macro observation. b ICRS macroscopic assessment scoring. c H&E staining. d Safranin O staining, e Mankin Score. f Col2 staining. g Col2 content ratio quantification

