Fig. 2.
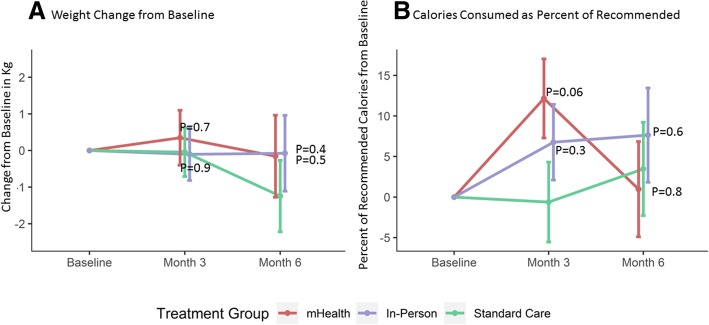
Change in weight and calories consumed by intervention group. a Change in weight from baseline by intervention group using measured clinic weights. b Calories consumed as a percent of calculated dietary requirements by intervention group at each visit. Red = mHealth; Blue = In-person dietary counseling; Green = Standard Care. Error bars represent 1 standard error around the mean

