Figure 4.
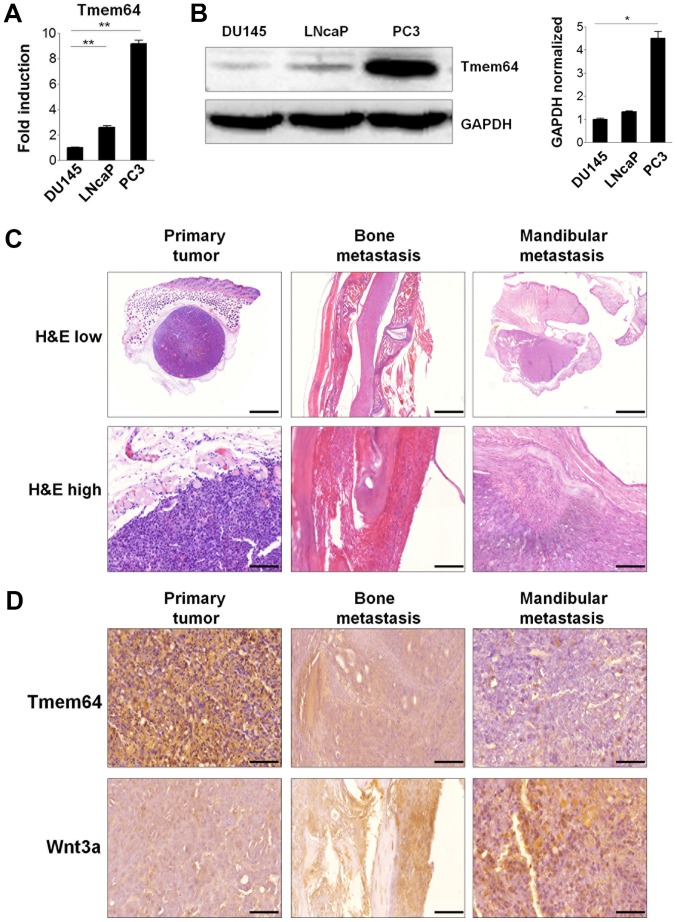
Tmem64 expression in prostate cancer cells and bone metastatic progression. (A) Total RNA was isolated from the indicated cell lysates as described and the mRNA levels of Tmem64 were assessed by reverse transcription-quantitative polymerase chain reaction. Data are presented as the mean ± standard deviation of samples in triplicate. (B) Protein levels of Tmem64 in various prostate cancers were measured by immunoblotting (left panel). GAPDH was used as the loading control. A representative image of three independent experiments is shown. The bar graph was generated by quantifying band intensities from three independent experiments using ImageJ and normalizing the intensity of the bands to that of the total protein, which was set to one (right panel). *P<0.05 and **P<0.01, as indicated (C) Representative histological sections of tissues bearing subcutaneous tumors generated by PC3 inoculation, and tumors generated after intracardiac injection in the mandibular and spine are shown at both low magnification (magnification, ×10; scale bar, 2,000 µm, upper panel) and high magnification (magnification, ×40; scale bar, 100 µm, lower panel). (D) Immunohistochemical staining of Tmem64 and Wnt3a in the subcutaneous primary, mandibular and spinal tumors generated by PC3 cells are shown. Positive staining in the subcutaneous nuclei and cytoplasm of tumors (magnification, ×400; scale bar, 50 µm). Tmem64, transmembrane protein 64; H&E, hematoxylin and eosin.

