
Figure 2.
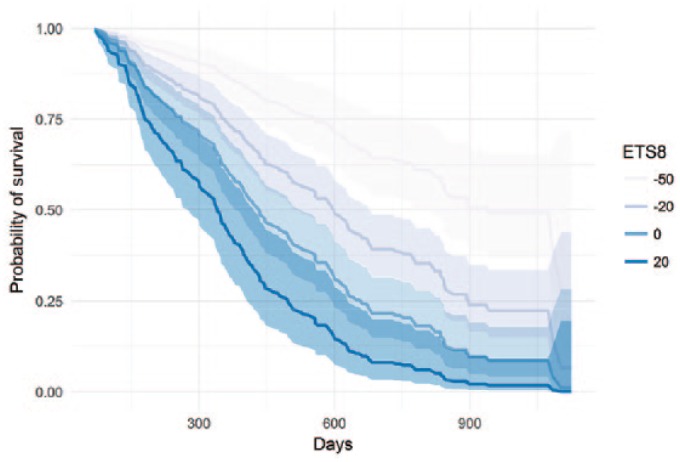
Predicted probability of survival for various levels of (%) in absence of ascites.
Shaded areas correspond to the parametric 95% confidence interval around the mean probability.
Official websites use .gov
A
.gov website belongs to an official
government organization in the United States.
Secure .gov websites use HTTPS
A lock (
) or https:// means you've safely
connected to the .gov website. Share sensitive
information only on official, secure websites.
Predicted probability of survival for various levels of (%) in absence of ascites.
Shaded areas correspond to the parametric 95% confidence interval around the mean probability.