
Fig. 1.
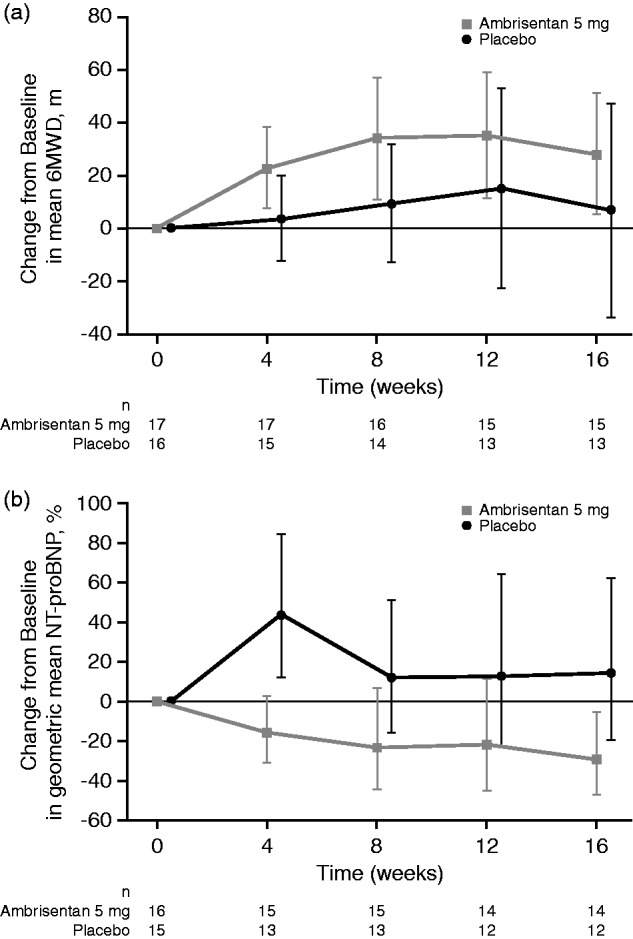
Change from baseline over 16 weeks in (a) 6MWD and (b) NT-proBNP in the double-blind study (observed case data, ITT population). Error bars represent 95% CI values. For NT-proBNP, values shown are the percent change in the geometric mean ratio of week 16 to baseline. 6MWD, 6-min walk distance; CI, confidence interval; ITT, intent-to-treat; NT-proBNP, N-terminal pro-B-type natriuretic peptide.