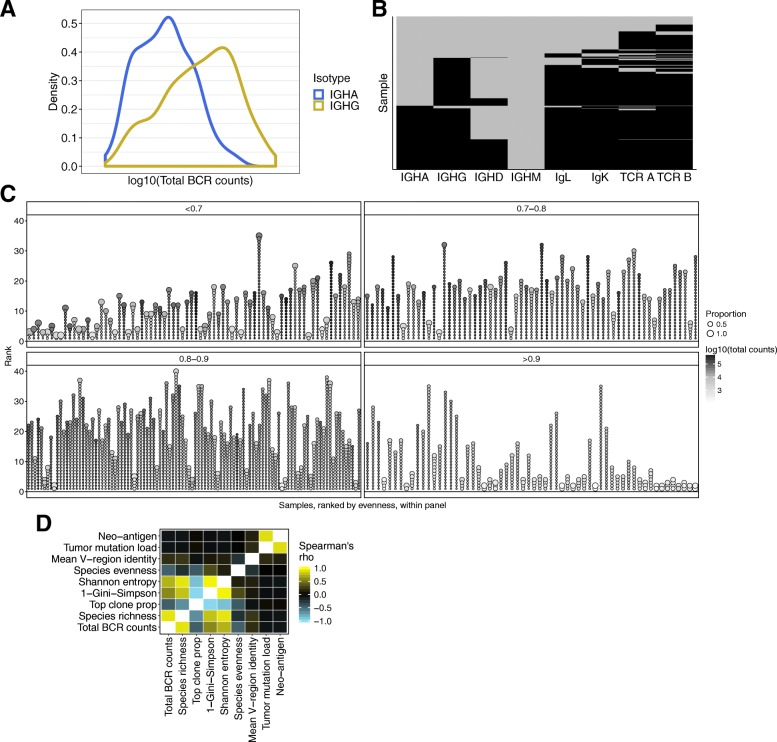
Fig. 1.
B cell receptor data. a Density plot of total BCR counts for IGHG (yellow) and IGHA (blue). b Assembled “chain” status for TCGA SKCM (n = 473). The samples are on the y-axis, each row is one sample, and chain types are on the x-axis. Black tiles indicate that a sample has at least one assembled sequence and gray is none. The samples are ordered by status for each chain type, from left to right on the x-axis. c Visual depiction of clonality for the entire TCGA melanoma cohort with a successfully assembled BCR (n = 337). x-axis displays each individual tumor sample. The y-axis is the rank of the proportion of each clone within a tumor. Each unique IGHG BCR sequence (clone) with a relative proportion > 0.01 is represented by a circle. The diameter of each circle represents the proportion of the sequence for each sample. The circles are ordered by proportion, rank, in descending order. Grayscale represents the total BCR counts. The samples are split into four sub-panels based on species evenness and ordered by low to high evenness within each sub-panel. d Pair-wise correlation heatmap. The color in each cell represents Spearman’s rank correlation coefficient of IGHG measurements correlated with IGHG measurements. Samples included in this analysis are TCGA SKCM samples with a value for each feature analyzed. See Additional file 2: Table S1. * p value < 0.05, ** p value < 0.01, *** p < 0.005, **** p value < 0.0005

