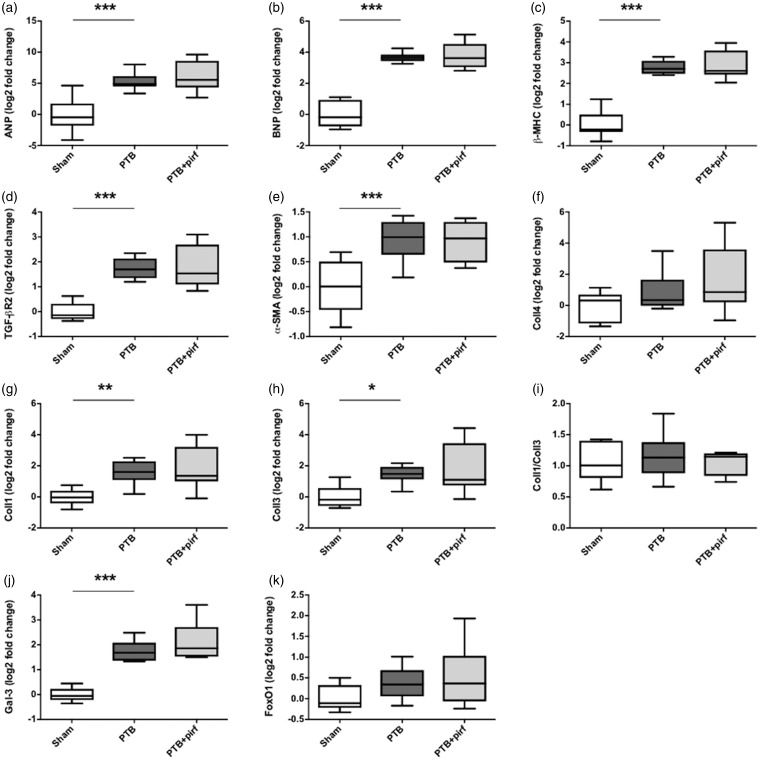
Fig. 2.
Effects of PTB and pirfenidone on gene expressions. mRNA expression levels of (a) atrial natriuretic peptide (ANP), (b) brain natriuretic peptide (BNP), (c) β-myosin heavy chain (β-MHC), (d) transforming growth factor-β (TGF-β) receptor type 2, (e) α-smooth muscle actin (α-SMA), (f) collagen IV (Coll4), (g) collagen I (Coll1), (h) collagen III (Coll3), (i) the collagen I/III ratio, (j) galectin-3 (Gal-3), and (k) FoxO1. Data are presented as box plots with whiskers representing minimum and maximum values. *P < 0.05, **P < 0.01, ***P < 0.001.

