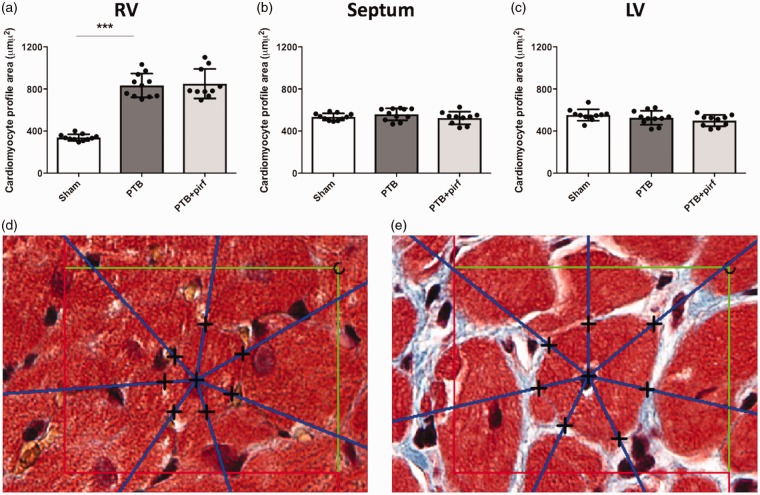
Fig. 4.
Effects of PTB and pirfenidone on cardiomyocyte profile area. (a) An increase in average cardiomyocyte profile area confirmed RV hypertrophy in the PTB rats. (b, c) There was no difference in septal or LV cardiomyocyte profile areas in the PTB rats compared with sham rats. (a–c) Pirfenidone treatment had no effects on cardiomyocyte profile area in either the RV, the septum, or the LV. Representative images of RV cardiomyocytes from (d) a sham rat and (e) a PTB rat with the test rays of the 2D IUR nucleator diverging from the nucleus of the cardiomyocytes. The black crosses indicate the intersections of the half-lines with the membrane of the cardiomyocyte profiles. The area of the unbiased counting frame is 3272 µm2. Data are presented as mean ± SD. ***P < 0.001.

