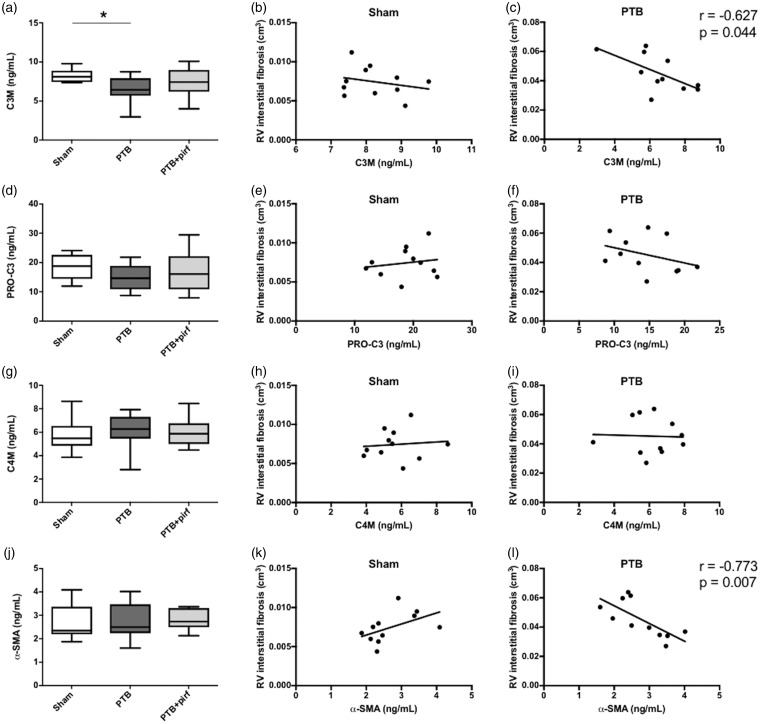
Fig. 5.
Biomarkers and RV fibrosis. Serum levels of (a) C3M and the correlations between serum C3M and RV interstitial fibrosis for (b) the sham rats and (c) the PTB rats at end of study. Serum level and correlations are shown similarly for (d–f) PRO-C3, (g–i) C4M, and (j–l) α-SMA. Serum levels are presented as box plots with whiskers representing minimum and maximum values. Spearman’s correlation coefficient is shown only for statistically significant correlations. *P < 0.05.

