
Fig. 3.
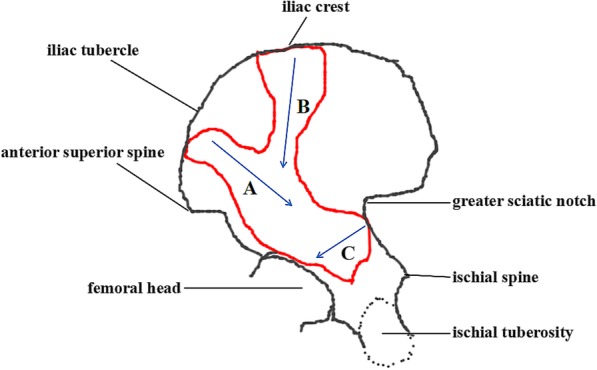
This image shows the area with high incidence of fractures (red line area) and main fracture lines (blue arrow marked with A, B and C)
Official websites use .gov
A
.gov website belongs to an official
government organization in the United States.
Secure .gov websites use HTTPS
A lock (
) or https:// means you've safely
connected to the .gov website. Share sensitive
information only on official, secure websites.
This image shows the area with high incidence of fractures (red line area) and main fracture lines (blue arrow marked with A, B and C)