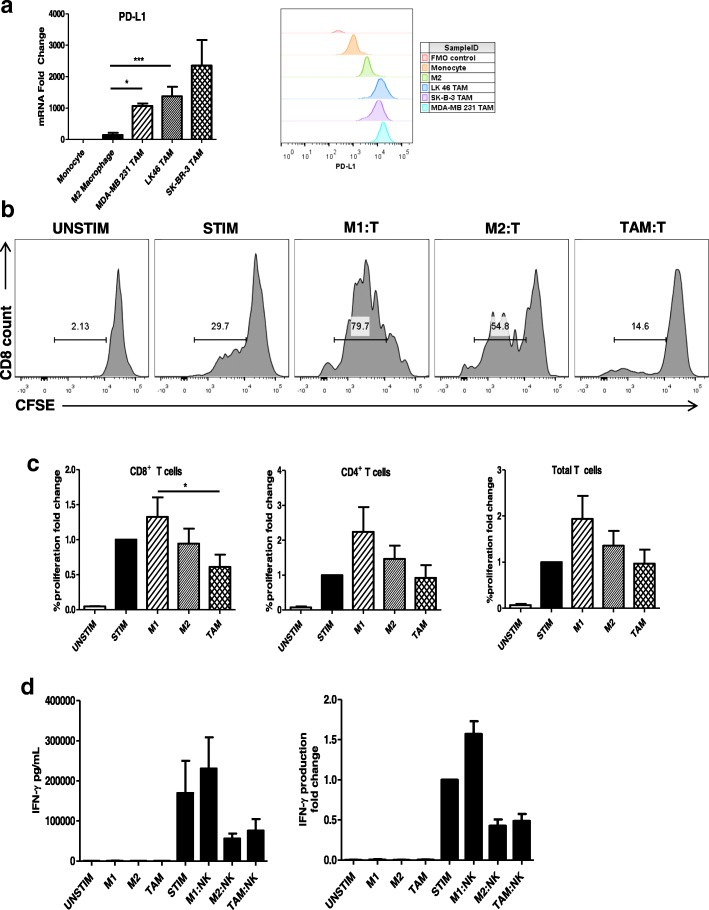
Fig. 5.
in vitro generated TAM inhibit T cell and NK cell function. (a) M2-like macrophages and in vitro generated TAM were analyzed by real-time PCR for transcript expression and flow cytometry for surface expression of PD-L1 CD3/CD28 bead activated T cells labelled with CFSE were co-cultured with M1-like and M2-like macrophages and MDA-MB 231 conditioned in vitro generated TAM at a 1:1 ratio. After 72 h cells were collected and (b) proliferation was evaluated by flow cytometry. Histograms show results from one representative experiment of CD8+ T cells. (c) Percent T cell proliferation expressed as a fold change and percentage. Bars represent the mean concentration ± SD of T cell proliferation analyzed by flow cytometry. Data are representative of three independent experiments with similar results; p < 0.05. (d) NK cells stimulated with IL-12, IL-18 and immobilized IgG were co-cultured with M1-like and M2- like macrophages and MDA-MB 231-conditioned in vitro generated TAM at a 1:1 ratio for 72 h. Bars represent the mean concentration ± SD of IFN-γ content from culture supernatants analyzed by ELISA. Data are representative of three independent experiments with similar results

