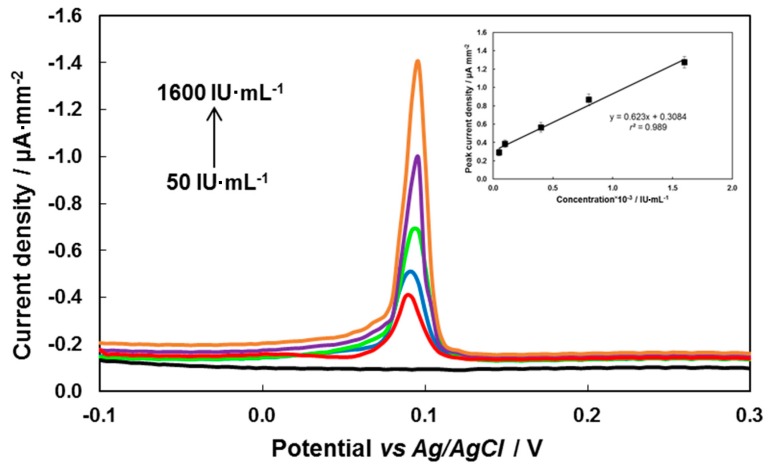
Figure 6.
Cathodic linear sweep voltammograms of AgCl at the gold–carbon composite electrode (GCCE); black line—without the antigen immobilized on the immunosensor surface; coloured lines—antigen immobilized on the electrochemical immunosensor with the different concentration of antibodies (50, 100, 400, 800, 1600 IU·mL−1). Inset plot: corresponding calibration curve (error bars for n = 5, P = 0.95) in supporting electrolyte of 0.15 mol·L−1 HNO3 and 0.01 mol·L−1 KCl. Scan rate of 100 mV·s−1, Eacc = −0.8 V, tacc = 60 s.

