Figure 6.
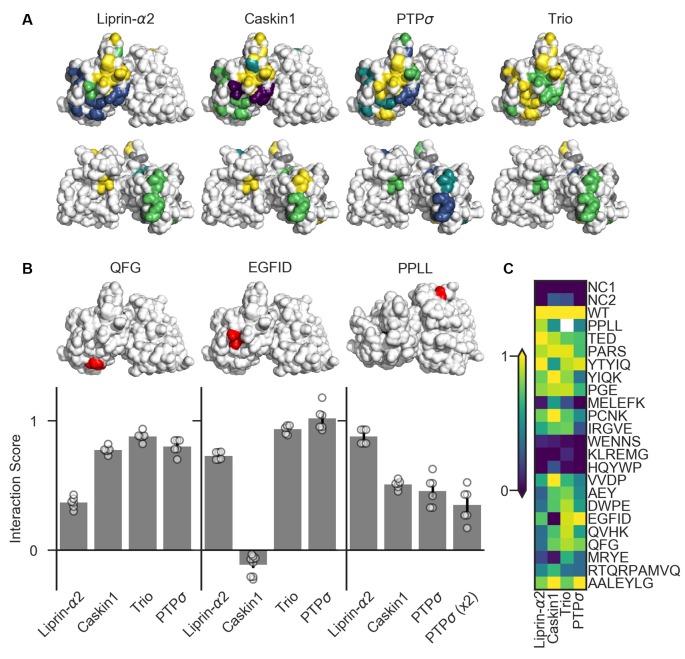
Identification of PTPσ mutations to disrupt specific interactions. (A) Interaction scores for each ligand in the dihydrofolate reductase (DHFR) protein complementation assay mapped onto the PTPσ crystal structure (Hou et al., 2011). Interaction scores are divided into five bins and colored accordingly: <0.2 purple; 0.2–0.4 blue; 0.4–0.6 teal; 0.6–0.8 green; >0.8 yellow. Mutants which showed an interaction score <0.3 for at least three ligands are shown in gray. Top row shows the D1 domain on the right and D2 on the left. Second row shows the same structures, flipped horizontally. (B) Quantification of mutants that were used in subsequent experiments. Models above each plot are the same crystal structures as shown in the top row in (A), with the indicated mutation shown in red. The model for PPLL is rotated forward slightly relative to the others in order to make these residues visible. Note that horizontal axis is different for PPLL since this mutation was not tested for interaction with trio, and since in the case of PTPσ homodimerization we also tested the condition where both copies of PTPσ carried the mutation [PTPσ (x2)]. Data are mean ± SEM. (C) Heatmap showing interaction scores for 22 different PTPσ multi-point mutations. NC1 indicates the negative control where the DHFR C-terminal fragment was fused to YFP or NgCAM instead of the indicated ligand; NC2 indicates the negative control where the DHFR N-terminal fragment was fused to NgCAM or YFP instead of to PTPσ. Interaction scores represent the growth rate of the indicated strain in MTX-containing media relative to MTX-free media and relative to controls, with 0 indicating the same relative growth rate as NC1 and one indicating the same relative growth rate as WT PTPσ. Values higher than 1 or lower than 0 are clipped to 1 and 0. White indicates no data (residues affected by the PPLL mutation are not present in the fragment of PTPσ used to test interaction with trio). Data are based on two experiments per condition and three replicates per experiment.

