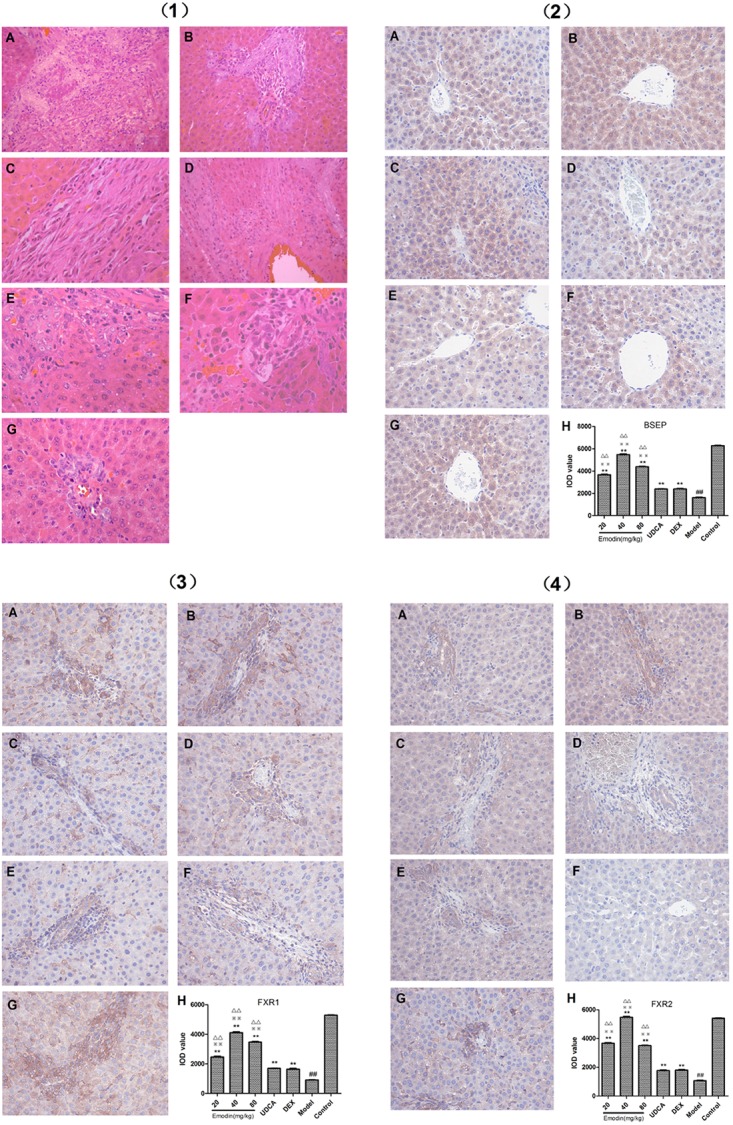
FIGURE 9.

(1) Effect of emodin on pathological manifestation of hepatic tissue by HE staining at 400× magnification (A: emodin 20 mg/kg group; B: emodin 40 mg/kg group; C: emodin 80 mg/kg group; D: UDCA group; E: DXM group; F: model group; G: control group). (2) Effect of emodin on BSEP expression was examined with IHC at 400× magnification (A: emodin 20 mg/kg group; B: emodin 40 mg/kg group; C: emodin 80 mg/kg group; D: UDCA group; E: DEX group; F: model group; G: control group. Values are the means ± SD. n = 3, ##P < 0.01 compared to the control group, ∗∗P < 0.01 compared to the model group; 
 p < 0.01 compared to the UDCA group; ΔΔp < 0.01 compared to the DXM group, as determined by Student’s t-test). (3) Effect of emodin on FXR1 expression was examined with IHC at 400× magnification (A: emodin 20 mg/kg group; B: emodin 40 mg/kg group; C: emodin 80 mg/kg group; D: UDCA group; E: DXM group; F: model group; G: control group. Values are the means ± SD. n = 3, ##P < 0.01 compared to the control group, ∗∗P < 0.01 compared to the model group;
 p < 0.01 compared to the UDCA group; ΔΔp < 0.01 compared to the DXM group, as determined by Student’s t-test). (4) Effect of emodin on FXR2 expression was examined with IHC at 400× magnification (A: emodin 20 mg/kg group; B: emodin 40 mg/kg group; C: emodin 80 mg/kg group; D: UDCA group; E: DEX group; F: model group; G: control group. Values are the means ± SD. n = 3, ##P < 0.01 compared to the control group, ∗∗P < 0.01 compared to the model group;
 p < 0.01 compared to the UDCA group; ΔΔp < 0.01 compared to the DXM group, as determined by Student’s t-test).
