
Figure 2.
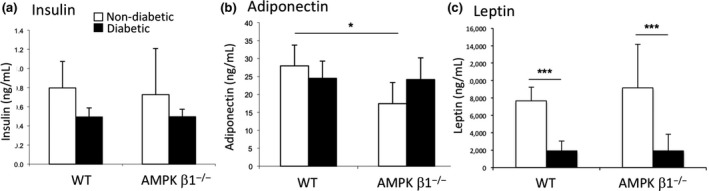
Serum insulin (A), adiponectin (B) and leptin (C) concentration WT and AMPK β1−/− mice 28 days after induction of diabetes as measured by ELISA. Control WT and AMPK β1−/− mice (white bars), diabetic WT and diabetic AMPK β1−/− mice (black bars). n = 3‐7 per group. (A) Insulin: WT control n = 8, WT diabetic n = 7, AMPK β1−/− control n = 8, AMPK β1−/− diabetic n = 6. B, Adiponectin: WT control n = 3, WT diabetic n = 7, AMPK β1−/− control n = 3, AMPK β1−/− diabetic n = 6. C, Leptin: WT control n = 3, WT diabetic n = 6, AMPK β1−/− control n = 3, AMPK β1−/− diabetic n = 6. *P < 0.05, ***P < 0.001. Mean + standard deviation