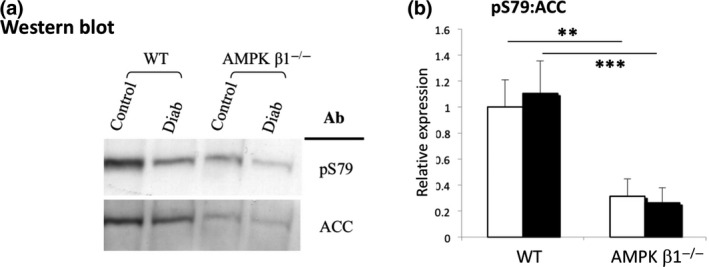
Figure 4.

ACC phosphorylation in kidneys from diabetic and non‐diabetic WT and AMPK β1−/− mice 28 days after induction of diabetes. (A) Western blot of pACC1 S79, and total ACC1/2 expression in kidneys from diabetic and non‐diabetic WT and AMPK β1−/− mice 28 days after induction of diabetes. Lysates were immunoprecipitated with streptavidin, and then blotted and probed with streptavidin and antibodies against pS79. (B) Densitometric analysis of Western blots showing relative expression of pS79. WT control n = 3, WT diabetic n = 5, AMPK ββ1−/− control n = 3, AMPK β1−/− diabetic n = 5. **P < 0.01, ***P < 0.001. Non‐diabetic (white bars), diabetic (black bars)
