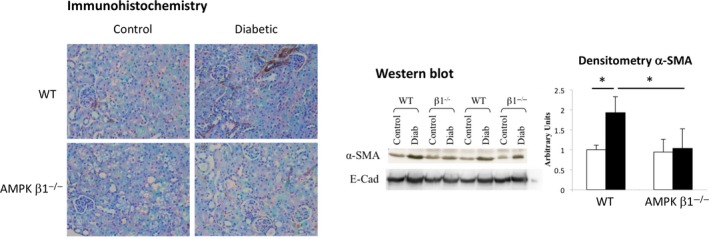
Figure 6.

Expression of α‐smooth muscle actin (α‐SMA) in diabetic and non‐diabetic WT and AMPK β1−/− mice 28 days after induction of diabetes. (A) Immunodetection of α‐smooth muscle actin (α‐SMA) in kidney sections. Original magnification: × 400. Enlarged for clarity. (B) Western blots for α‐SMA and E‐cadherin. C, α‐SMA blots were quantitated by densitometry. E‐cadherin showed no difference and is not shown. WT control n = 3, WT diabetic n = 5, AMPK β1−/− control n = 3, AMPK β1−/− diabetic n = 5. *P < 0.05. Mean + standard deviation [Colour figure can be viewed at wileyonlinelibrary.com]
