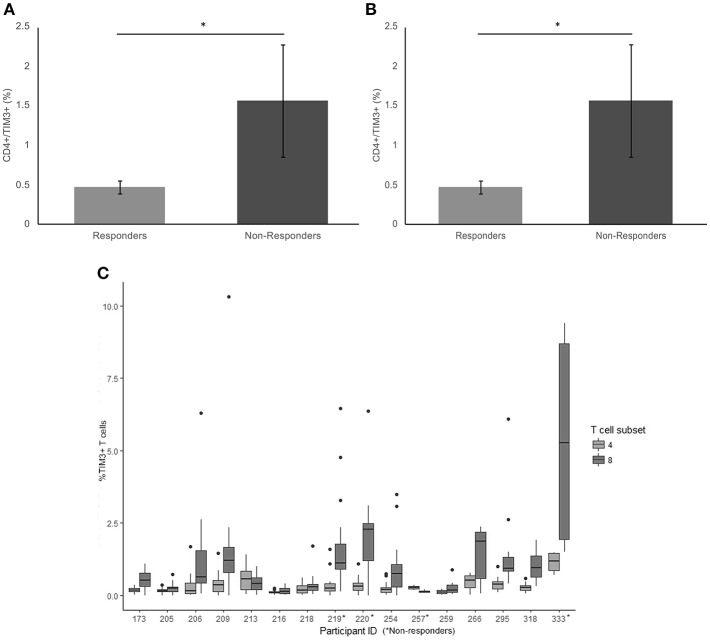
Figure 2.
Frequency of TIM3 expression on CD4+ and CD8+ T cells. (A) The mean percentage of CD4+ T cells expressing TIM3 in non-responders responders to pembrolizumab (B) The mean percentage of CD8+ T cells expressing TIM3 in non-responders responders to pembrolizumab (C) Boxplot of mean frequency of TIM3 on CD4+ and CD8+ T cells per patient per cycle. *p < 0.05.

