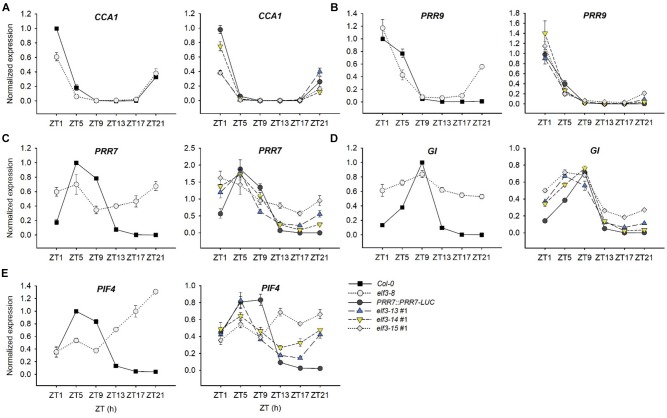
FIGURE 7.
Transcript abundance patterns of select clock genes in elf3 mutants. 11-day old seedlings were collected from ZT1 to ZT21 every 4 h under 12L:12D white-light cycles. Input RNA was normalized to a U-box gene (At5g15400) and expression levels of each transcript were standardized to the peak levels in Col-0 set to 1. (A) Transcript profile of CCA1. (B) Transcript profile of PRR9. (C) Transcript profile of PRR7. (D) Transcript profile of GI. (E) Transcript profile of PIF4. Error bars show SEM from three biological trials.

