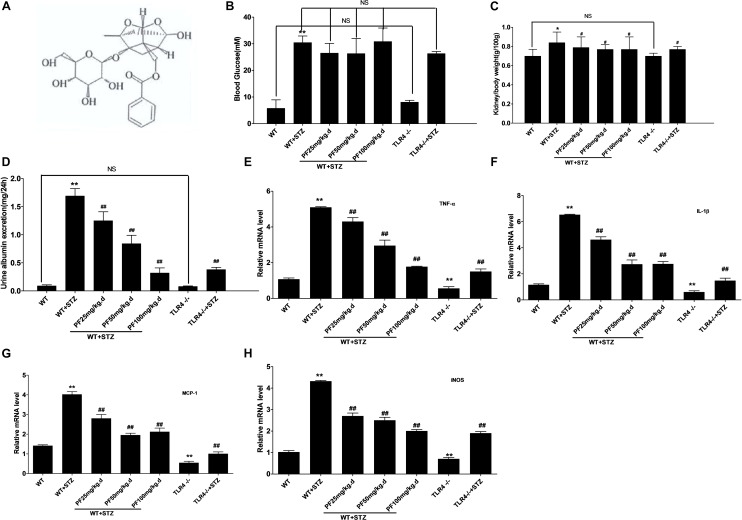
FIGURE 1.
PF improved clinical symptoms and alleviated inflammation. (A) The chemical structure of paeoniflorin. (B) Blood glucose levels. (C) Kidney /body weight. (D) Urine albumin excretion. Data were detected and are presented as the mean ± SD of at least three independent experiments. n = 12 in each group. NS: not significant; ∗p < 0.05 and ∗∗p < 0.01 vs. WT; #p < 0.05 and ##p<0.01 vs. WT+STZ. (E–H) Expression of iNOS, TNF-α, IL-1β, and MCP-1 in renal tissue. The results are represented as the mean ± SD of at least three repeated experiments. ∗p < 0.05 and ∗∗p < 0.01 vs. WT; #p < 0.05 and ##p < 0.01 vs. WT+STZ; NS, not significant.

