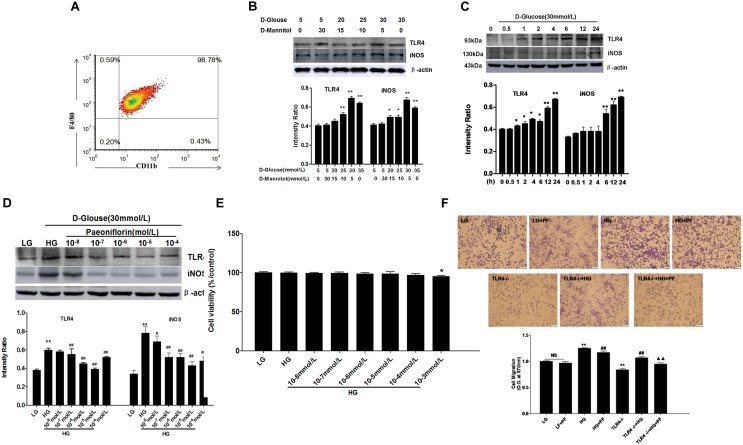
FIGURE 4.
Cellular experimental conditions. The optimal concentration and stimulation time of D-glucose and the optimal PF concentration were determined first. (A) Identification of BMDMs. (B) Effects of different high concentrations of glucose on TLR4 expression and BMDM activation. (C) Effects of high-glucose stimulation on TLR4 and BMDM activation at different time points. (D) Effects of various PF concentrations on TLR4 expression and BMDM activation. (E) Cell viability detected using a CCK-8-based assay. (F) Cell migration detected by the Transwell method. Values are expressed as the mean ± SD of at least three independent experiments. NS: not significant; ∗P < 0.05 and ∗∗P < 0.01 vs. the LG group; #p < 0.05 and ##p < 0.01 vs. the HG group; ▲P < 0.05, ▲▲P < 0.01 vs. the TLR4-/-+HG group.

