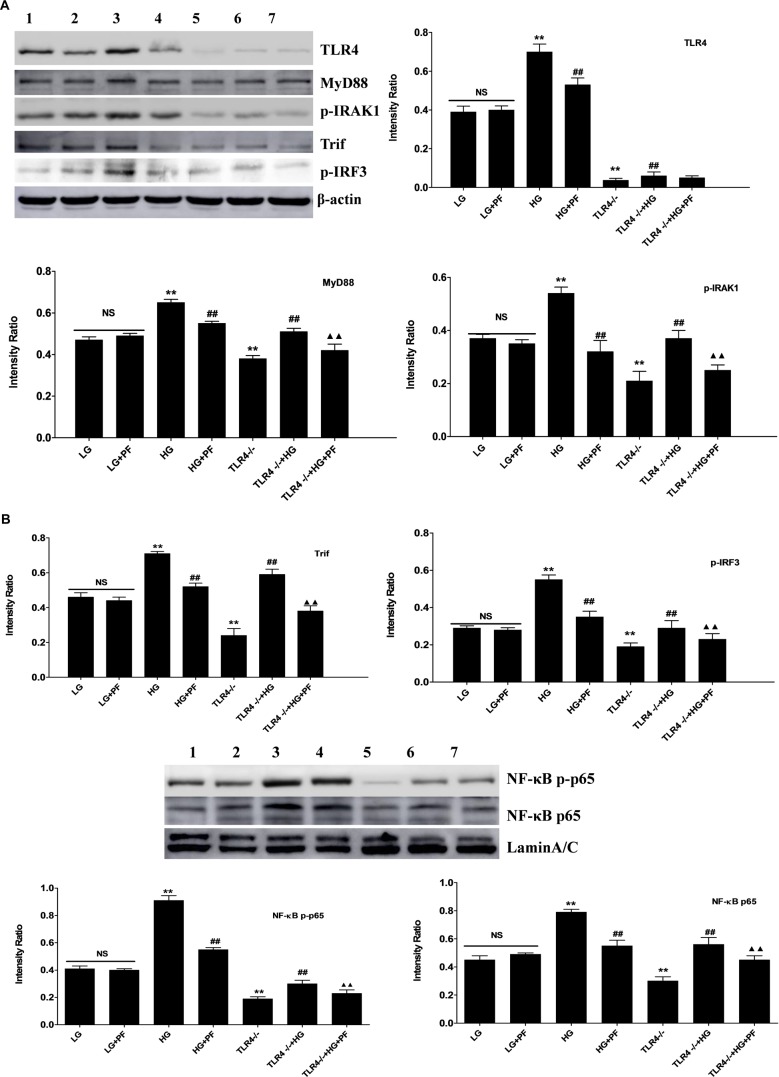
FIGURE 7.
PF inhibited the activation of TLR4 and its downstream signaling pathway in HG-induced BMDMs. (A) Densitometric analyses of the protein levels of TLR4, MyD88, p-IRAK1, Trif, p-IRF3 and IRF3 in HG-treated BMDMs. (B) Densitometric analyses of the protein levels of NF-κB p-p65, and NF-κB p65 in HG-treated BMDMs. All data were normalized to the β-actin level and are expressed as the mean ± SD from at least three independent experiments. NS: not significant; ∗P < 0.05 and ∗∗P < 0.01 vs. the LG group; #p < 0.05 and ##p < 0.01 vs. the HG group; ▲P < 0.05 and ▲▲P < 0.01 vs. the TLR4-/-+HG group. Lanes: 1, LG; 2, LG+PF; 3, HG; 4, HG+PF; 5, TLR4-/-; 6, TLR4-/-+HG; and 7, TLR4-/-+HG+PF.

