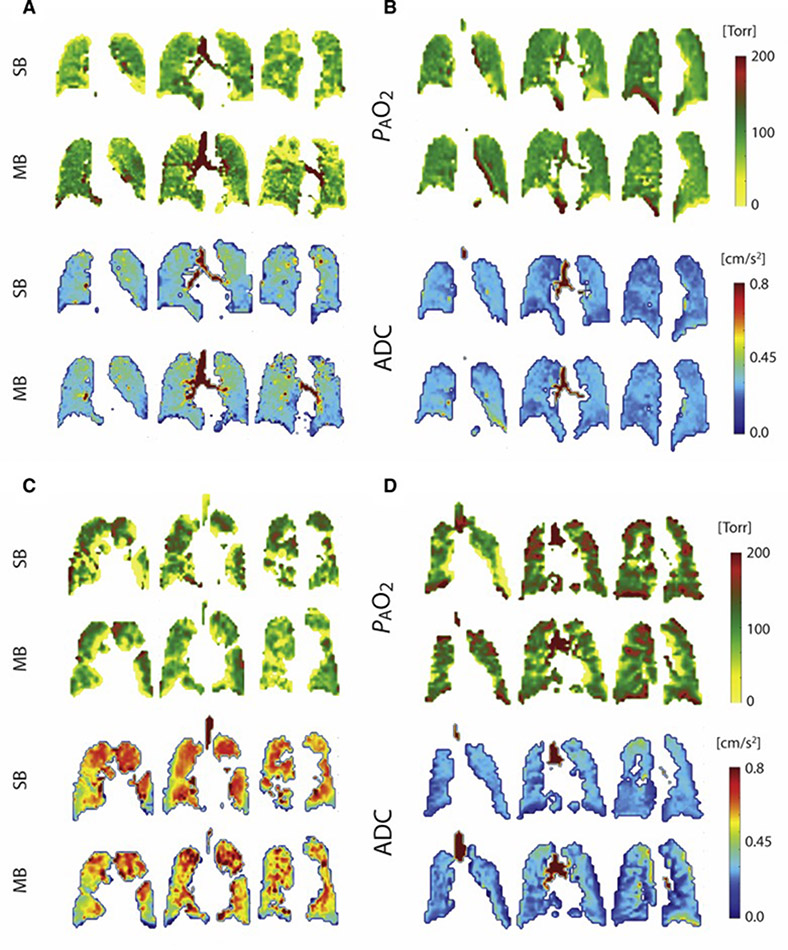
Figure 5).
PAO2 maps (top) and ADC maps (bottom) in four representative subjects (clockwise from top left: AS3: Age 67 yrs., FEV1/FVC: 72%; AS4: Age: 62 yrs., FEV1/FVC: 77; COPD1: Age 70 yrs., FEV1/FVC: 35%; COPD5: Age: 61 yrs; FEV1/FVC: 49%).
In the PAO2 maps, the color scale differentiates regions of abnormally high PAO2 values, which may correlate with slow-filling regions, from those with abnormally low PAO2 values, which may correlate with over-inflation and subsequent loss of signal intensity through resolution of pressure gradients. In the ADC maps, the color scale highlights regions of extremely high diffusion, which could be indicative of emphysema.

