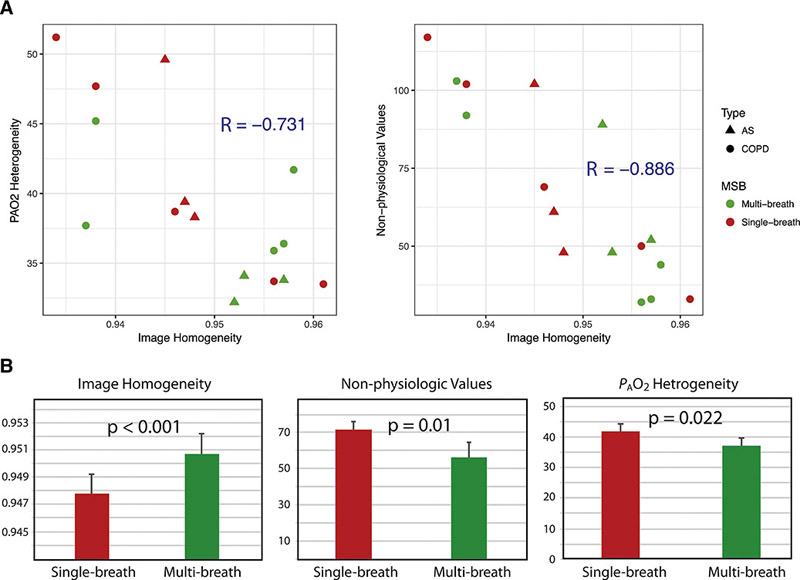
Figure 6).
Image (spin density) homogeneity, as calculated from the homogeneity marker (refer to methods), plotted against PAO2 heterogeneity (a, left). Image homogeneity plotted against the number of non-physiological values (a, right). Bar graphs comparing image homogeneity, non-physiologic values, and PAO2 heterogeneity in single-breath versus multi-breath imaging.

